Learn
Metabolic Health Testing: A Practical Guide to Key Markers
Learn what metabolic health testing actually measures, from glucose and insulin to lipids and HOMA-IR, plus how to interpret results and improve them over time.
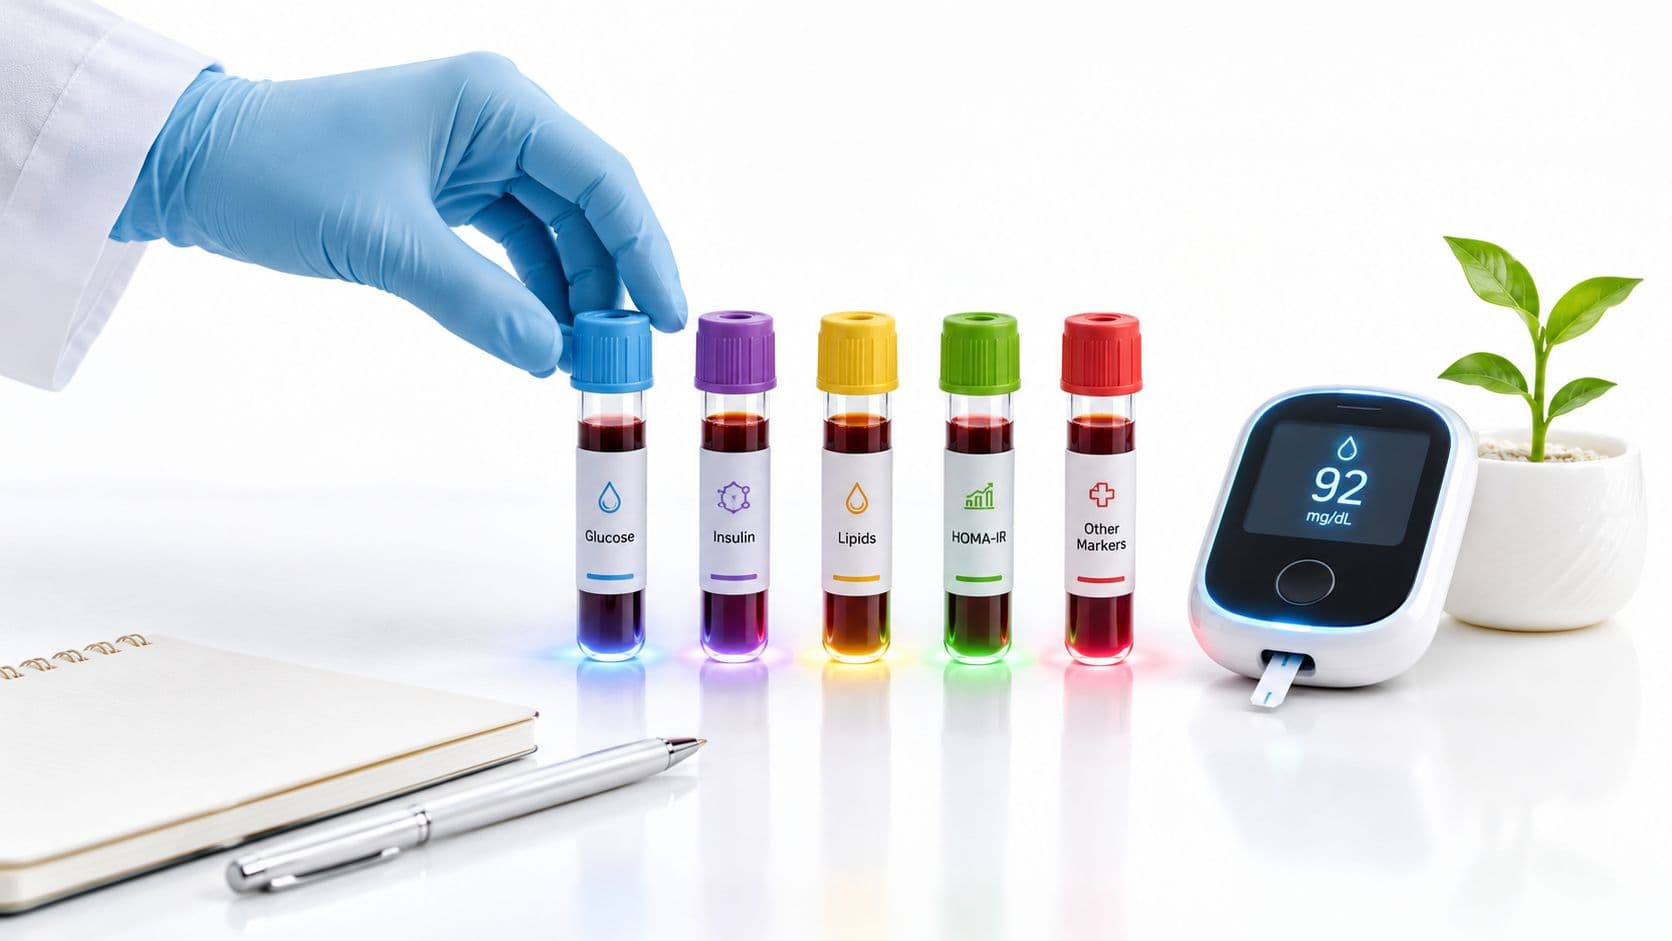
You've had a few months of restless sleep, a heavier feeling after meals, and an afternoon energy dip that coffee no longer fixes. At your annual checkup, your fasting glucose comes back “normal,” so the report looks reassuring. Yet your waistline is expanding, triglycerides are creeping upward, and you're hungry again soon after eating.
That situation is common because metabolic health isn't a glucose story alone. It's a story about how effectively your body responds to insulin, stores and transports fat, manages blood pressure, and handles energy over time. A well-designed metabolic health testing plan looks for the pattern before a single abnormal result announces a larger problem.
Table of Contents
- What Metabolic Health Testing Actually Measures
- The Five Core Markers You Should Understand
- Why Insulin Resistance Often Hides in Normal Glucose
- Advanced Markers Worth Adding After 40
- How Often to Test for a Clearer Trend
- Reading Your Results as a Connected Pattern
- Turning Better Numbers Into Daily Habits
- Common Questions and Misconceptions
What Metabolic Health Testing Actually Measures
Metabolic health testing measures a connected system, not one green check mark on a lab report. Blood glucose tells you how much sugar is circulating at one moment. HbA1c adds a longer view of average glucose. A lipid panel shows how your body is transporting fats and cholesterol. Waist circumference and blood pressure add context about abdominal fat and cardiovascular strain.
Those measurements are useful, but they still capture only part of the physiology. A person can have glucose and HbA1c within a standard reference range while producing more insulin than usual to keep glucose there. That compensatory effort may be relevant to daily hunger, energy stability, fat storage, and future cardiometabolic risk.
For adults in midlife, the practical question is simple: which markers reveal early drift, and which merely confirm that the process has progressed far enough to become visible? The answer usually starts with combining glucose with fasting insulin, HbA1c, triglycerides, HDL-C, and a calculated measure such as HOMA-IR. More advanced testing can then add information about atherogenic particles, inflammation, liver stress, or real-world glucose responses.
The traditional five metabolic syndrome criteria are waist circumference, triglycerides, HDL-C, blood pressure, and fasting glucose. Common adult cut points include waist circumference above 40 inches in men or 35 inches in women, triglycerides of at least 150 mg/dL, HDL-C below 40 mg/dL in men or 50 mg/dL in women, blood pressure of at least 130/85 mmHg, and fasting glucose of at least 100 mg/dL. Meeting three of the five supports a metabolic syndrome diagnosis, as outlined in the clinical overview of metabolic syndrome criteria.
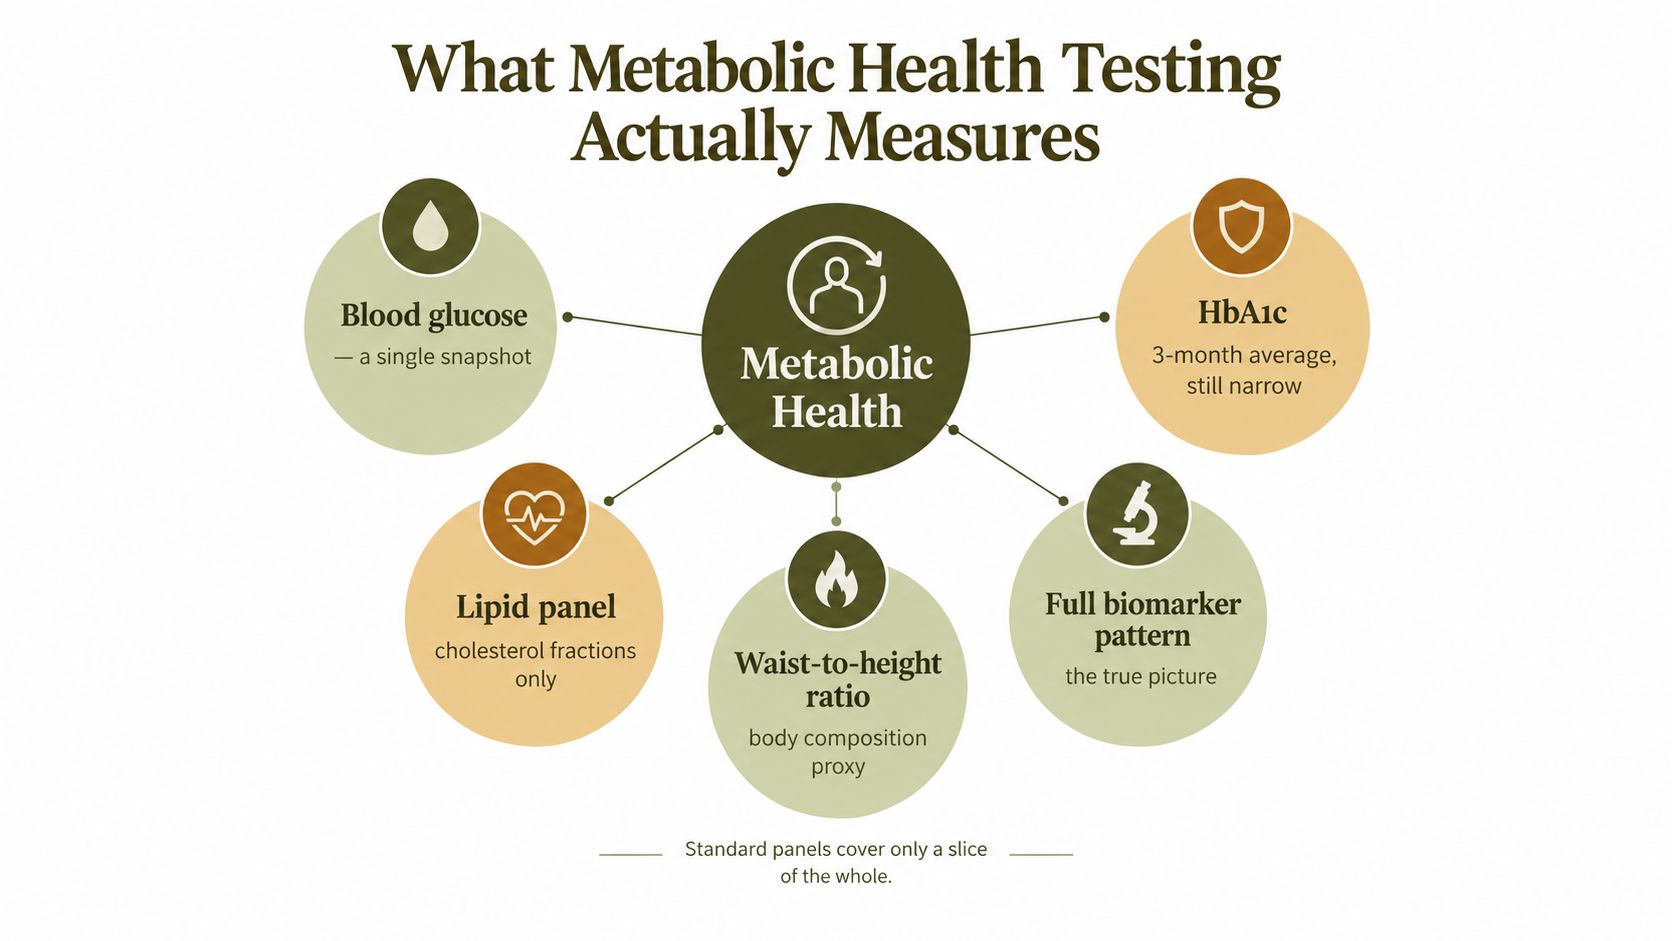
The purpose isn't to collect the largest possible panel. It's to identify meaningful changes early, then connect those changes to practical decisions about food, movement, sleep, stress, and medical follow-up.
The Five Core Markers You Should Understand
A midlife lab panel can look reassuring at first glance. Fasting glucose may sit comfortably in range while insulin is working harder to keep it there. Reading these five markers together helps distinguish stable glucose regulation from early compensation and makes the rest of your report easier to interpret.
| Marker | What It Measures | Typical Reference Point | What It Signals |
|---|---|---|---|
| Fasting glucose | Blood glucose after an overnight fast | A common clinical concern threshold is 100 mg/dL or higher | Higher results can indicate impaired glucose regulation |
| Fasting insulin | Insulin required to maintain fasting glucose | Fasting insulin is often discussed in the 2–5 µIU/mL range, but assay differences mean you should compare it with your laboratory's reference interval | Higher levels can suggest compensation for reduced insulin sensitivity |
| HbA1c | Average blood glucose over a longer window | Read it against your laboratory's reference interval and clinical context, alongside fasting glucose | A useful average that can still miss meal-related variation and early compensation |
| Triglycerides and HDL-C | Blood fats and cholesterol transport | Triglycerides below 150 mg/dL, HDL-C above 40 mg/dL in men or 50 mg/dL in women are common clinical cut points | The combined pattern can point toward insulin-resistance physiology |
| HOMA-IR | An estimate calculated from fasting glucose and fasting insulin | Values commonly cited around 1.0–2.0 are often considered more favourable, but methods and populations differ | A higher result can support the interpretation that insulin is working harder to control glucose |
The glucose, triglyceride, HDL-C, waist, and blood pressure cut points used in metabolic-syndrome screening are summarized in the NHLBI/AHA metabolic syndrome criteria. Fasting insulin, HbA1c, and HOMA-IR require context. Fasting conditions, assay methods, laboratory intervals, medications, and health status can all affect interpretation.
What each marker means in daily life
Fasting glucose is a single morning snapshot. It may look steady while the pancreas produces more insulin to maintain that result. HbA1c covers a longer period, like an average speed, but an average can hide sharp rises after meals or differences between morning and evening.
Fasting insulin shows more of the effort behind the glucose number. A higher insulin result with normal glucose can indicate compensation. That pattern may fit frequent hunger, energy swings, or increasing central fat, although no individual result proves the cause.
Triglycerides and HDL-C carry more meaning as a pair than separately. Higher triglycerides alongside lower HDL-C can support an insulin-resistance pattern, particularly when waist circumference is also increasing.
HOMA-IR puts fasting glucose and fasting insulin into one calculated estimate. It is not a diagnosis. It gives you a way to view two related measurements together, then discuss the pattern with a qualified clinician. For wider context on how health measures are grouped, review these examples of biomarkers.
Why Insulin Resistance Often Hides in Normal Glucose
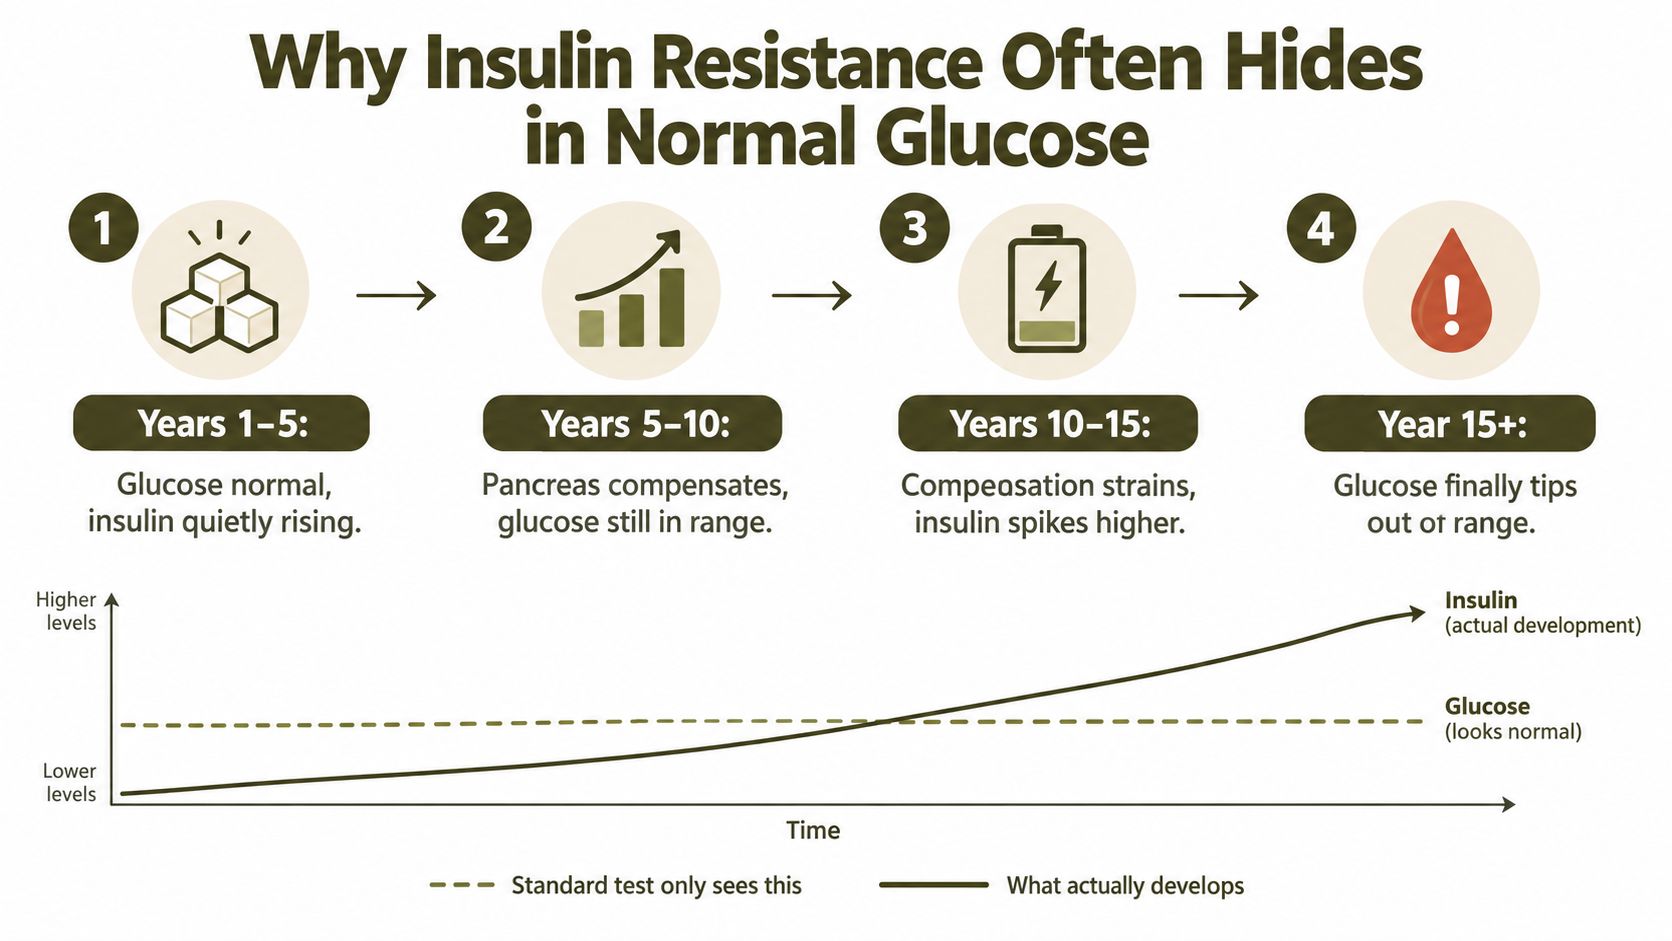
The body can preserve a normal glucose result by increasing insulin output. In practical terms, the pancreas sends a stronger signal because muscle and other tissues aren't responding as efficiently to the original signal. The glucose result may stay reassuring while fasting insulin rises.
That compensation can continue for years. This is why normal glucose doesn't automatically mean optimal insulin sensitivity. HbA1c and fasting glucose remain valuable, but they describe glucose exposure, not the full amount of insulin required to control it.
A fasting insulin result can expose that extra effort. HOMA-IR adds a calculated view using fasting insulin and glucose. C-peptide offers another perspective on pancreatic insulin production, while continuous glucose monitoring can show meal-related spikes and overnight patterns that a fasting sample won't capture. Expert reviews describe metabolic assessment as including lipid testing alongside glucose-metabolism measures such as HbA1c and oral glucose tolerance testing, as discussed in this review of metabolic syndrome laboratory assessment.
The pattern clients often miss
A midlife client may report stubborn weight gain, a strong desire for snacks, or an afternoon crash. Their fasting glucose may still sit inside the laboratory range. If fasting insulin and HOMA-IR are also measured, the results may provide a more coherent explanation than glucose alone.
That interpretation still requires care. Sleep disruption, recent illness, medication, training status, and the timing of the sample can influence results. The point isn't to label every tired person as insulin resistant. It's to avoid treating a normal glucose value as proof that no metabolic change is occurring.
A large U.S. population analysis illustrates why awareness alone can underestimate metabolic syndrome. NHANES-based data reported adult prevalence at 25.9% in 2008, while self-reported diagnosis in a screening questionnaire was only 0.6% across 211,097 participants. The same analysis found metabolic syndrome in 43% of adults aged 65 and older, compared with 16% of adults aged 18 to 44, showing why objective testing becomes increasingly relevant through midlife and later adulthood. See the NHANES analysis of metabolic syndrome prevalence.
A useful question at your next appointment is not only, “Is my glucose normal?” Ask, “How much insulin does my body need to keep it normal, and do my lipids and waist measurement tell the same story?”
Advanced Markers Worth Adding After 40
Once the core panel is clear, add tests that answer a specific question. More data isn't automatically better. Each marker should help distinguish cardiovascular particle burden, inflammation, liver stress, or real-world glucose variation.
Apolipoprotein B, or ApoB, estimates the number of atherogenic particles that can contribute to arterial plaque formation. It can add information when LDL cholesterol appears acceptable but the broader lipid pattern remains concerning. High-sensitivity C-reactive protein, or hs-CRP, gives context about low-grade inflammation, though it can also rise with an acute infection or recent injury.
Liver markers deserve attention because metabolic dysfunction can involve more than glucose. ALT and GGT may prompt a closer look at liver stress and the wider metabolic picture. Uric acid is often discussed only in relation to gout, but it can also sit within a broader cardiometabolic assessment.
Continuous glucose monitoring has a different role. A short trial can show how meals, sleep, stress, and exercise affect glucose in daily life. It's best treated as a pattern-discovery tool, not a permanent requirement or a replacement for clinical blood work.
| Marker | What It Reveals | Typical Target Range |
|---|---|---|
| ApoB | Number of atherogenic particles | Use the clinician's risk-based target rather than assuming the LDL range answers the question |
| hs-CRP | Inflammation context | Interpret away from acute illness and alongside the broader profile |
| ALT and GGT | Liver stress and possible metabolic context | Use the laboratory range and investigate persistent elevation |
| Uric acid | A cardiometabolic signal that may add context | Interpret with kidney, medication, dietary, and clinical factors |
| Continuous glucose monitoring | Meal, sleep, stress, and overnight glucose patterns | Look for repeatable patterns rather than one isolated reading |
Recent expert coverage describes broader testing that may include renal markers, urinary albumin-to-creatinine ratio, insulin, C-peptide, ApoB, hs-CRP, GGT, uric acid, and liver-focused assessment. The practical lesson is to choose additions based on your age, history, symptoms, and existing results, rather than ordering every available marker at once. You can review the rationale for this broader multisystem view of metabolic dysfunction.
How Often to Test for a Clearer Trend
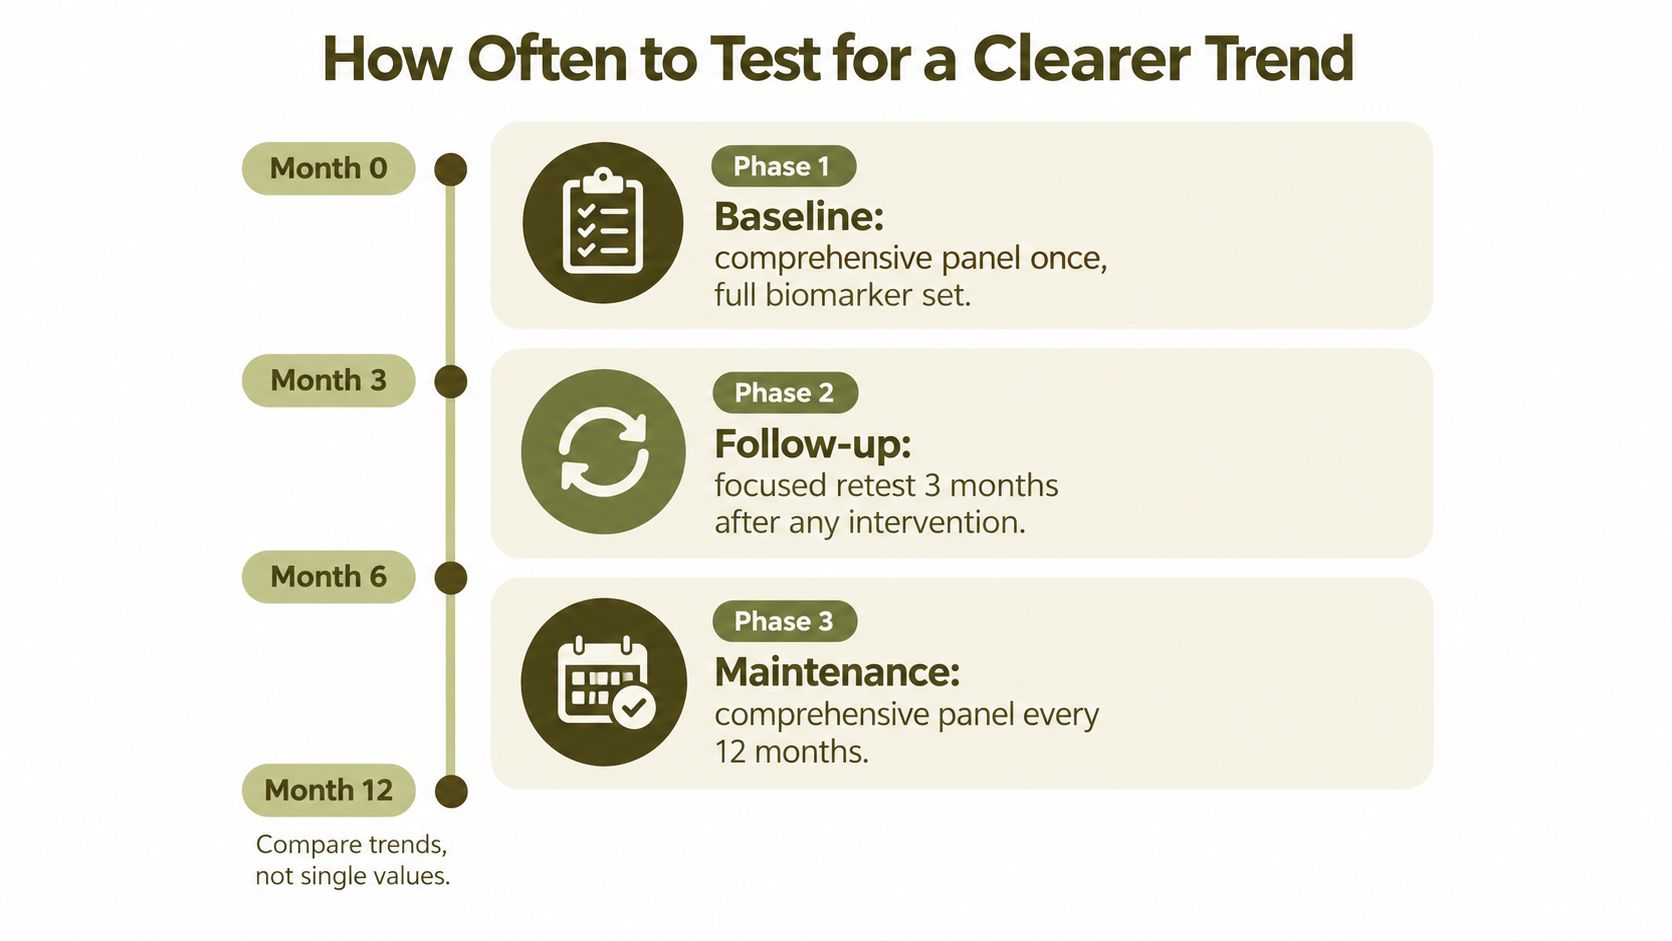
A useful testing rhythm has three stages. First, establish a baseline with the core markers and any additions that answer a clear clinical question. Second, repeat the most relevant markers after a meaningful intervention. Third, maintain a regular schedule when the profile is stable.
For many adults, a practical follow-up point is three months after a sustained change in eating, activity, sleep, or weight-management habits. That interval appears in the requested testing framework because it gives the intervention time to produce a measurable pattern, without waiting so long that you lose feedback. For stable profiles, a full review every 12 months can create a useful long-term record, with clinician-guided adjustments when a result is borderline or symptoms change.
Make comparisons fair
Use the same laboratory when possible, follow its fasting instructions, and record unusual circumstances. Travel, illness recovery, a short-term restrictive diet, unusually hard training, or disrupted sleep can make a single result harder to interpret.
Life stage matters too. Menopause-related changes, altered training volume, and recovery from illness can shift glucose, lipids, appetite, or body composition. That doesn't make the result meaningless. It means the context belongs beside the number.
Practical rule: compare trends under similar conditions, and avoid making a major decision from one unexpected flag.
A review of screening practice found that metabolic testing has often been incomplete. In one analysis, routine baseline testing exceeded 50% for blood pressure and triglycerides, while glucose and cholesterol were measured in fewer than 50% of people with mental illness. The same review described a clinical study in which only 2 subjects, or 0.6%, received screening for all five metabolic syndrome components. These gaps are discussed in the review of metabolic screening practices. A complete baseline matters because trends are only useful when you measure the relevant parts of the system.
For a broader look at blood testing in a longevity context, see this guide to longevity blood tests.
Reading Your Results as a Connected Pattern
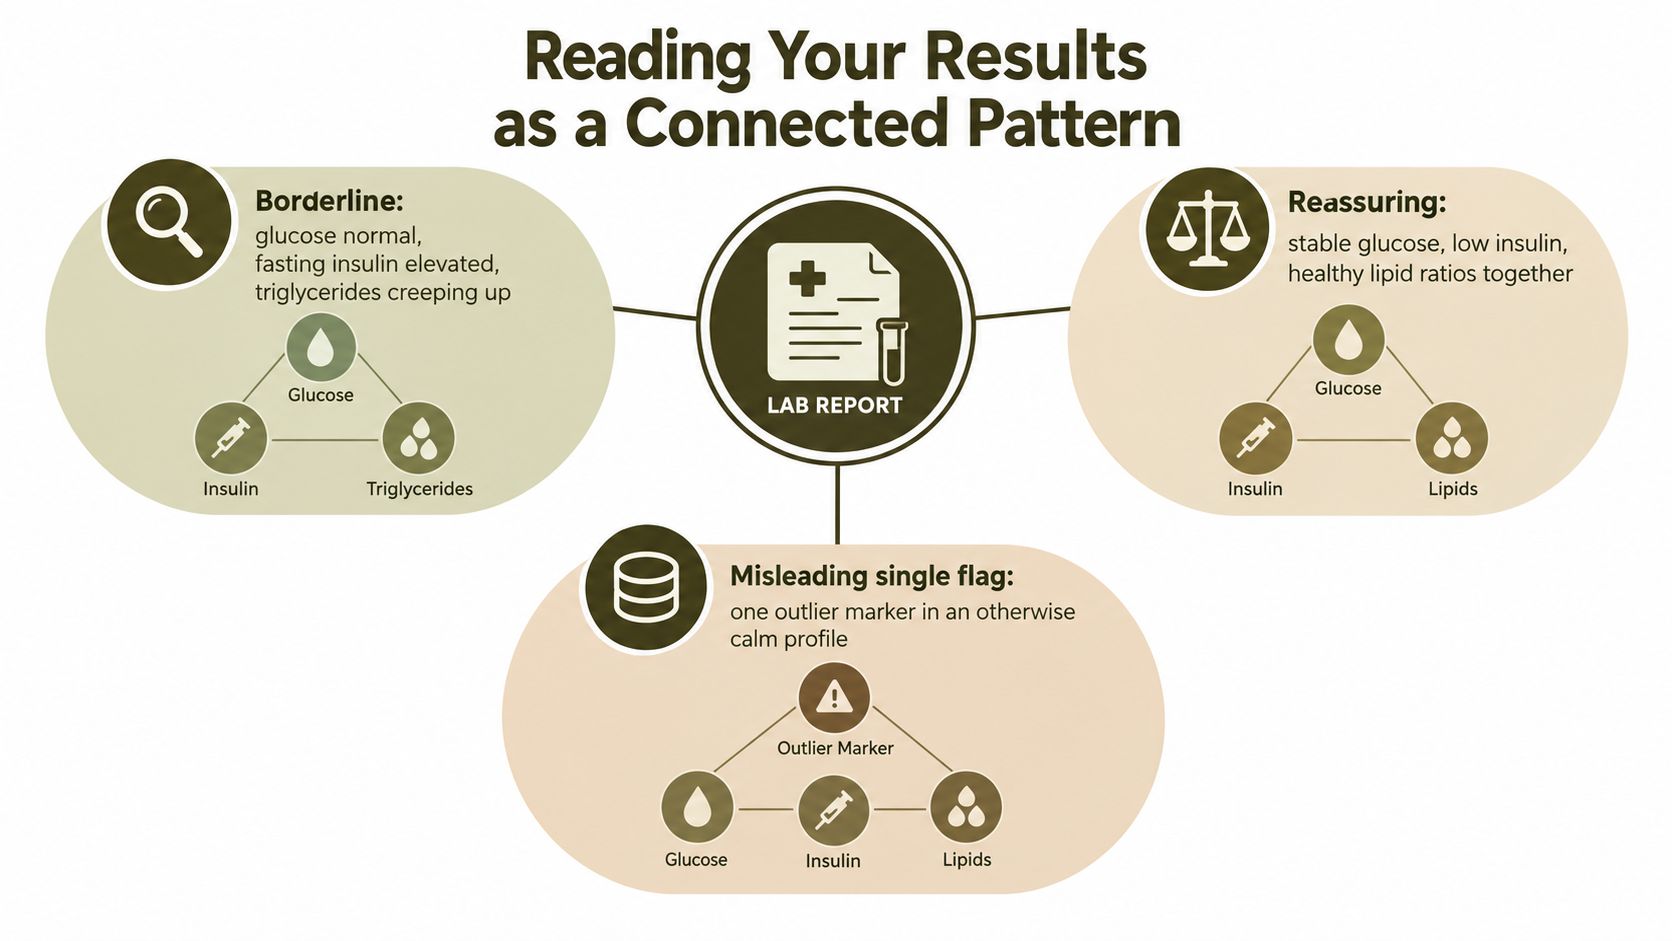
Read across the report before reacting to individual red flags. Start with glucose and HbA1c, then compare fasting insulin, triglycerides, HDL-C, waist circumference, and blood pressure. Add liver, inflammatory, or particle markers only when they help answer the question raised by the core pattern.
A borderline pattern
Suppose fasting glucose is within the laboratory range, but fasting insulin is higher than expected for your clinical context, triglycerides are moving upward, and waist circumference has increased. No single marker proves insulin resistance. Together, however, they suggest that glucose control may be requiring more insulin effort than before.
That pattern deserves a conversation about meals, activity, sleep, medications, family history, and follow-up testing. The triglyceride-to-HDL relationship can add context, but it should be interpreted as part of the complete profile rather than treated as a diagnosis.
A more concerning pattern
A profile combining high ApoB, raised hs-CRP, and higher HOMA-IR points in several directions at once. ApoB raises the question of atherogenic particle burden. hs-CRP adds inflammatory context. HOMA-IR suggests that insulin and glucose regulation may be under strain.
That combination warrants professional interpretation, especially if blood pressure, waist circumference, liver enzymes, or symptoms also point in the same direction. It's more useful to investigate the connected pattern than to chase whichever result is printed in bold.
An improving pattern
Progress doesn't always begin with weight loss. After a consistent period of better meals, regular movement, and improved recovery, triglycerides, fasting insulin, and GGT may move in a favorable direction even when body weight hasn't changed. That can indicate a meaningful shift in metabolic physiology.
Retest under comparable conditions and look for several aligned signals. A single lower value is encouraging. Multiple related markers moving together are more persuasive.
The same principle applies to biological aging discussions. Biomarkers can inform a broader picture, but they don't replace medical history or clinical judgment. For more context, explore biological age versus chronological age.
Turning Better Numbers Into Daily Habits
A lab result becomes useful when it changes what you do repeatedly. Choose one or two inputs, track them consistently, and use the next testing point to see whether the relevant markers moved.
Build meals around protein and minimally processed foods. Pairing protein with fiber-rich carbohydrates and healthy fats can make meals more satisfying and may help reduce sharp post-meal glucose responses. Your goal isn't dietary perfection. It's a repeatable structure you can maintain through busy workdays.
Use resistance training as a metabolic signal. Strength work challenges muscle tissue to use glucose and supports functional capacity. Add it consistently rather than relying on occasional punishing sessions. Walking after meals can also be a practical way to add movement without turning every health decision into a major project.
Protect a consistent sleep window. Poor sleep can make appetite, energy, and morning glucose harder to manage. Anchor your wake time, reduce late-night stimulation, and treat sleep regularity as part of the metabolic plan rather than a reward you earn after everything else is finished.
Attach stress reduction to an existing cue. A short breathing practice after closing your laptop, a walk after lunch, or a quiet transition before dinner is easier to repeat than an ambitious routine with no place in the day.
Retesting after 8 to 12 weeks of consistent habits can help you judge whether the input is working, as long as you follow the same preparation instructions and account for illness or unusual stress. Fasting insulin, triglycerides, and HOMA-IR are more useful as feedback when you change one or two variables at a time instead of trying to optimize everything simultaneously.
Common Questions and Misconceptions
Can normal fasting glucose hide insulin resistance?
Yes, it can. The pancreas may produce additional insulin to keep glucose within range. That's why fasting insulin, HOMA-IR, C-peptide, triglycerides, waist circumference, and HbA1c can provide context that fasting glucose alone doesn't offer.
Does one high result matter?
It matters as a prompt, not as a verdict. A single result can reflect fasting conditions, illness, medication, training, sleep disruption, or ordinary biological variation. Repeat an unexpected finding under comparable conditions and review it with your clinician.
Is HOMA-IR always reliable?
HOMA-IR is an estimate, not a direct measurement of every aspect of insulin sensitivity. Its interpretation can change with the fasting insulin assay, the laboratory, and the clinical context. Use it to support a pattern, not to make a diagnosis in isolation.
What if one marker improves and another doesn't?
Look for the reason behind the mismatch. Triglycerides may improve while LDL-related particle burden remains a concern. Glucose may remain stable while insulin rises. One favorable result shouldn't erase a persistent abnormality, and one stubborn result shouldn't erase broader progress.
Are consumer CGMs useful without diabetes?
They can help some people observe responses to meals, sleep, stress, and exercise. They can also encourage unnecessary anxiety if every fluctuation becomes a target. A short, structured trial is more informative than constant checking without a question to answer.
Does clean eating automatically fix lipids?
No. Food quality matters, but lipid results also reflect genetics, insulin signaling, liver metabolism, activity, medications, and overall energy balance. A person can eat thoughtfully and still need a clinician to interpret persistent triglyceride, ApoB, or HDL-C findings.
Standard reference ranges and longevity-oriented targets aren't always identical. A result can be technically within range while still looking less favorable when viewed alongside your previous values, waist measurement, insulin, or family history. Metabolic health is a trajectory, not a verdict. Testing under similar conditions turns a number into information.
Longwelle offers a longevity-focused assessment, biomarker tracking, educational guidance, and access to licensed nurse practitioners for people who want help interpreting health data over time. Visit Longwelle to explore its approach and begin with a more structured view of your metabolic health.