Learn
10 Examples of Biomarkers for Healthy Aging
Explore 10 examples of biomarkers, how they are measured, and what they may reveal about metabolic health, inflammation, recovery, and aging.

Most healthy-aging advice collapses everything into one score. A glucose number. A cholesterol number. A biological age number from a sleek dashboard. That's appealing, but it's a bad way to think about biomarkers.
Biomarkers aren't diagnoses, and they aren't guarantees of longer life. They're measurable signals. The modern clinical definition comes from the NIH Biomarkers Definitions Working Group, which described a biomarker as a characteristic that is objectively measured and evaluated as an indicator of normal biological processes, disease processes, or responses to treatment. That broad definition helped standardize how clinicians and researchers use blood tests, imaging, physiologic measures, and molecular signals across medicine, as summarized in this history of biomarker definitions.
That breadth matters. Biomarkers can come from blood pressure, blood tests, genes, imaging, and other physiologic measurements, and they can reflect exposure, effect, or susceptibility, as outlined in this overview of biomarker scope and use. For healthy aging, the practical value usually comes from four habits: establish a baseline, understand what a test can and can't tell you, follow trends over time, and connect results to supervised lifestyle decisions.
You'll see that logic in the examples below. They fit into a practical healthspan framework: metabolic markers, inflammatory markers, hormonal markers, cellular senescence markers, and epigenetic clocks. Some change quickly. Some move slowly. Some are useful now. Others are still more experimental for everyday longevity tracking, especially in areas like non-invasive aging biomarkers and digital biomarker tools, where progress is real but uneven, as noted in this industry overview of biomarker trends.
If you want structure, Longwelle is one example of a service that combines an assessment, biomarker monitoring, educational guidance, and optional licensed nurse practitioner consultations for adults who want healthy-aging support without treating every lab result like a verdict.
Table of Contents
- 1. VO2 Max
- 2. HbA1c
- 3. High-Sensitivity C-Reactive Protein
- 4. Lipid Panel
- 5. Thyroid Function Tests
- 6. Apolipoprotein B and LDL Particle Number
- 7. Homocysteine
- 8. Fasting Glucose and Glucose Tolerance
- 9. Sleep Duration and Quality Markers
- 10. Longwelle Integration and Cross-cutting Recommendations
- Comparative Overview of 10 Biomarkers
- Build a Biomarker Plan You Can Actually Use
1. VO2 Max
VO2 max is one of the clearest examples of biomarkers that isn't a blood test. It reflects how much oxygen your body can use during intense exercise, which makes it a practical marker of cardiorespiratory fitness.

For healthy aging, VO2 max matters because it captures how well your lungs, heart, blood vessels, and muscles work together. A wearable estimate from Apple Watch, Garmin, or Oura can give you directional feedback. A treadmill or bike test with gas analysis gives you a more precise number.
How to use it well
This is a fast-changing marker compared with many lab tests. If you start regular aerobic training, walking hills, cycling, rowing, or interval sessions, you may see the trend move over months rather than years.
What matters most isn't chasing a perfect score. It's watching whether your baseline is holding, improving, or slipping.
- What it measures: Aerobic capacity and cardiovascular fitness.
- How it's tested: Lab exercise test or wearable estimate.
- How quickly it can change: Often within a training block.
- Best interpreted with: Resting heart rate, exercise tolerance, sleep quality, and recovery patterns.
Practical rule: Use wearable VO2 max as a trend signal, not a verdict.
A useful real-world approach is simple. Get a baseline. Follow a consistent training routine. Retest after a meaningful period instead of checking every day. If you want structured exercise habits, Longwelle's guided routines for energy, sleep, and vitality fit naturally with this kind of tracking.
For readers who want a quick explainer before testing, this short video helps clarify what VO2 max represents.
2. HbA1c
A normal-looking fasting glucose can miss a slow metabolic drift. HbA1c often catches that drift because it reflects how much glucose has been attaching to hemoglobin over time, giving a broader view of blood sugar exposure than a single morning lab value.
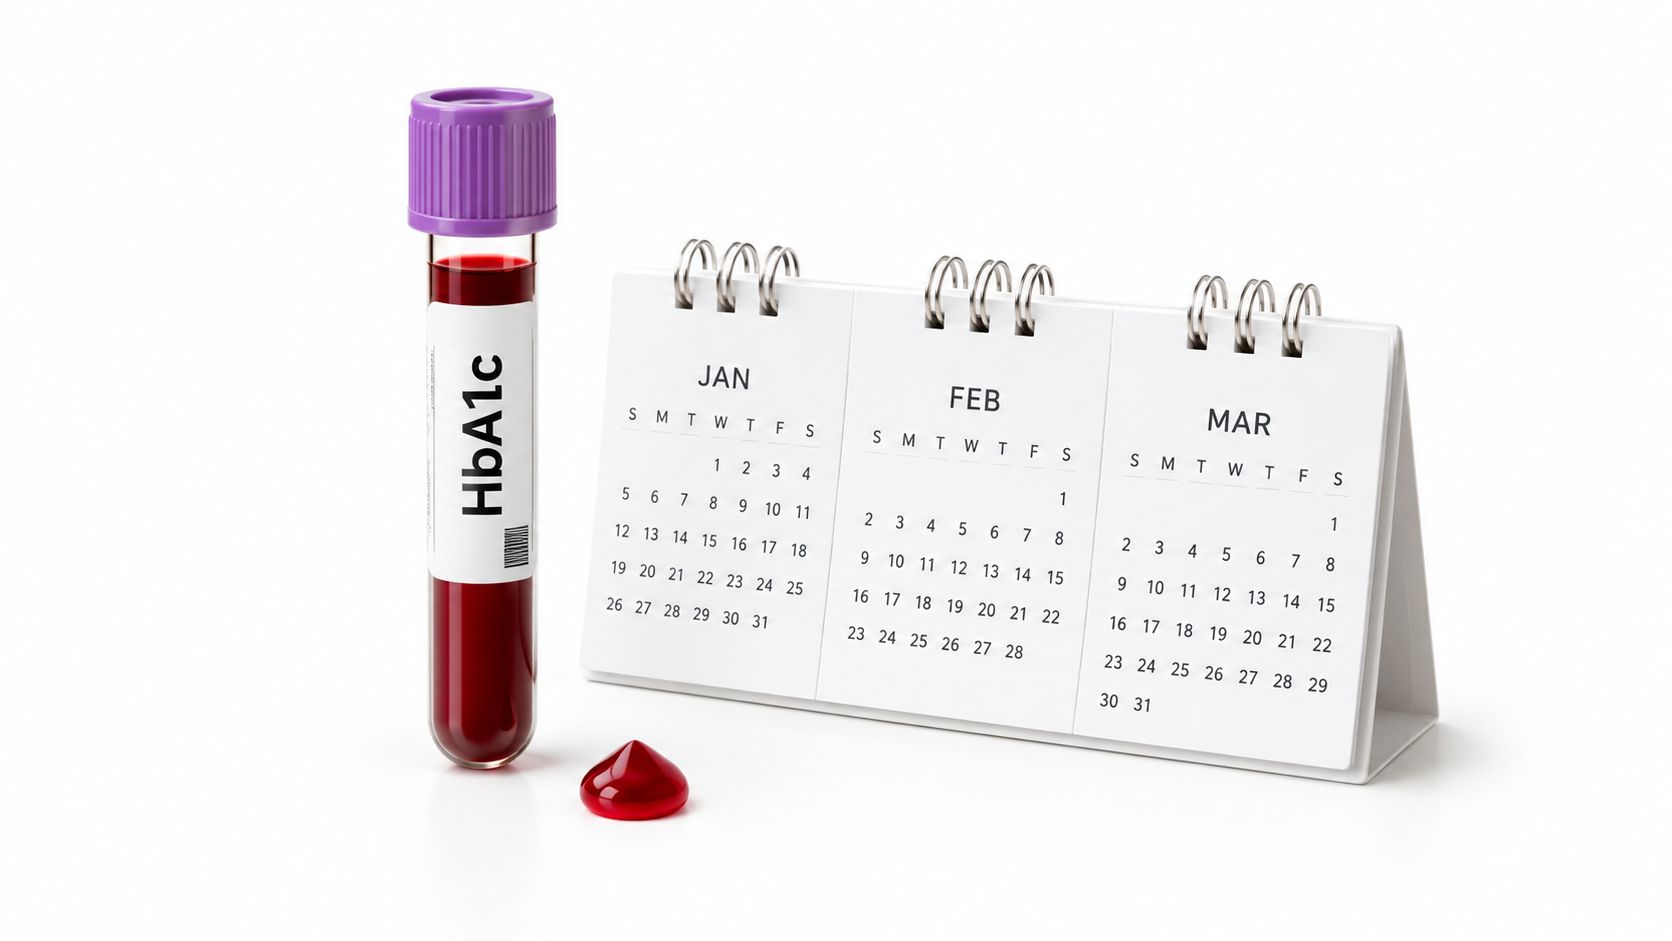
A useful way to read HbA1c is to treat it as a long-exposure photo. It captures the overall pattern better than the moment-to-moment motion. That makes it practical for healthspan tracking, but it also explains why HbA1c can look acceptable while meal responses or daily energy swings are still pointing to trouble.
Two people can land on a similar HbA1c for different reasons. One may run fairly steady glucose that stays mildly high throughout the day. Another may average out large post-meal spikes with low readings at other times. Same summary marker, different physiology, different next steps.
Use the marker with four questions in mind:
- What it measures: Average glucose exposure over the prior few months, reflected through glycated hemoglobin.
- How it's tested: A standard blood test, usually without any special meal preparation.
- How quickly it can change: Gradually. Meaningful shifts usually follow sustained changes in eating, activity, sleep, weight, or medication.
- What to pair it with: Fasting glucose, post-meal responses, waist size or body composition, exercise habits, and family history.
That pairing matters. HbA1c is better for spotting the direction of metabolic control than for explaining why the number moved.
If HbA1c is higher than expected, practical next steps usually focus on the basics that change glucose handling in real life: regular walking, especially after meals, resistance training to improve muscle glucose uptake, better sleep, and fewer ultra-processed foods. If HbA1c looks fine but symptoms or other glucose markers do not, that is a reason to look wider rather than assume everything is settled.
Read HbA1c as one panel in the dashboard, not the whole dashboard.
3. High-Sensitivity C-Reactive Protein
A low hs-CRP result does not automatically mean inflammation is settled, and a high result does not point to one clear cause. That uncertainty is exactly why this marker is useful. It acts more like a smoke alarm than a map. It signals that inflammatory activity may be present, but it does not show the room where the smoke started.
The practical question is not “Is hs-CRP good or bad?” The better question is, “What kind of signal is this, and does it match the rest of the dashboard?”
An elevated hs-CRP can show up after a recent infection, poor sleep, heavy training, dental inflammation, autoimmune disease, smoking, or excess visceral fat. Those scenarios do not carry the same long-term meaning. The number is real in each case, but the interpretation changes with timing and context.
Read hs-CRP as a signal strength marker
hs-CRP measures systemic inflammatory activity. The test is a standard blood draw using a high-sensitivity assay, which is designed to detect lower levels than a basic CRP test. That matters because small shifts can add context when you are assessing cardiometabolic risk, recovery, or the effect of lifestyle changes.
It can also move faster than many people expect. A tough training week, a respiratory illness, or several nights of poor sleep may shift it within days. Weight loss, better sleep consistency, smoking cessation, and treatment of an inflammatory condition can also change it. So this is not a marker to interpret casually from one isolated sample.
A more useful way to read hs-CRP is to place it into a small cluster:
- What it measures: General inflammatory signaling in the body
- How it's tested: Blood test with a high-sensitivity CRP assay
- How quickly it can change: Days to weeks, depending on illness, recovery, body fat, sleep, and treatment
- What to pair it with: Lipids, ApoB if available, glucose markers, blood pressure, symptoms, recent illness, and training load
Here is the trade-off. hs-CRP is sensitive, but it is not specific. It often picks up meaningful biological stress early, yet it cannot tell you whether the driver is metabolic strain, an infection, overreaching in training, or an inflammatory disorder.
That is why repeat testing under similar conditions matters. If hs-CRP stays high across multiple tests taken during stable weeks, the pattern usually deserves more attention than one stray result after a cold or a hard race.
A practical next step is simple. If the number is higher than expected, review the obvious confounders first: recent illness, injuries, dental issues, sleep disruption, smoking, body weight trends, and exercise recovery. Then look sideways at the rest of the healthspan picture. If lipids, blood pressure, glucose control, and waist size are also drifting in the wrong direction, hs-CRP adds weight to the idea that the issue is chronic rather than temporary.
Use hs-CRP as a context marker, not a verdict.
4. Lipid Panel
A lipid panel gets treated like a cholesterol scorecard. That shorthand misses the point.
This test is better used as a map with four landmarks: total cholesterol, LDL cholesterol, HDL cholesterol, and triglycerides. Each marker captures a different part of lipid transport and metabolic health, so one abnormal line can mean something very different from another.
Start with the practical question: what is this panel helping you detect? Mostly two things. First, it gives a rough view of particles and fats linked to plaque formation. Second, it offers clues about how the body is handling energy, especially when triglycerides and HDL shift alongside weight, waist size, or glucose markers.
A useful way to read it is by pattern.
High LDL cholesterol can point toward higher atherosclerotic risk, but LDL alone does not show how many atherogenic particles are circulating. High triglycerides often suggest a different problem set, such as insulin resistance, excess alcohol intake, calorie surplus, or poor metabolic flexibility. Low HDL can travel with that same pattern, though HDL by itself is not a treatment target in the way many people assume.
Here is where confusion often starts. Two people can have the same total cholesterol and very different health pictures. One may have isolated LDL elevation with normal triglycerides, normal glucose, and a strong exercise habit. Another may have modest LDL elevation plus high triglycerides, low HDL, rising HbA1c, and increasing waist circumference. Those are not interchangeable profiles, and they should not trigger the same conversation.
Use four questions to make the panel more actionable:
- What does it measure? Circulating cholesterol and triglyceride levels that help estimate cardiovascular and metabolic risk.
- How is it tested? A blood draw. Fasting is sometimes used, especially if triglycerides are a focus.
- How quickly can it change? Triglycerides can move within days to weeks. LDL and HDL often shift over weeks to months.
- What should you read alongside it? ApoB if available, blood pressure, hs-CRP, HbA1c or fasting glucose, waist size, diet pattern, exercise volume, medications, and family history.
The timing piece matters. Triglycerides are more like a weather report. They can swing after alcohol intake, weight change, poor sleep, or several weeks of overeating. LDL is usually slower and often reflects a more stable mix of genetics, diet composition, thyroid status, and medication effects.
That difference helps explain why isolated retesting can be useful. If triglycerides come back high after a holiday week or a period of heavy drinking, repeating the test under steadier conditions may clarify whether the result reflects a short-term spike or a durable pattern. If LDL stays high across repeat tests, especially with a strong family history, that usually deserves a more focused risk discussion.
A practical next step depends on which part of the panel is off. High triglycerides often justify a closer look at refined carbohydrate intake, alcohol, body weight trend, sleep, and glucose control. Higher LDL may push the conversation toward diet quality, saturated fat response, thyroid function, medications, and whether ApoB or LDL particle number would sharpen the picture.
The lipid panel is common because it is accessible and useful. Its real value shows up when you stop reading it as one score and start reading it as part of a healthspan framework. What is being measured, how stable it is, and which other markers are moving with it matter more than any single cholesterol number.
5. Thyroid Function Tests
Low energy often gets blamed on aging, stress, or "just being busy." Sometimes the simpler explanation is that thyroid signaling is off, and the body is running at the wrong speed.
Thyroid tests help sort that out. The usual starting set is TSH and Free T4, with Free T3 added in some cases. Together, they check the control system and the hormone supply. TSH reflects how hard the brain is pushing the thyroid. Free T4 shows how much hormone is available in circulation.
A thermostat analogy helps here. TSH works like the signal sent to the heater. Free T4 is closer to the heat being produced. A high TSH with a low Free T4 points toward one pattern. A low TSH with a high Free T4 points toward another. Normal-looking values can still require context, especially if symptoms, medication timing, pregnancy status, or recent illness complicate the picture.
Symptoms are the reason these tests matter. Fatigue, constipation, cold intolerance, palpitations, hair shedding, unexplained weight change, anxiety, and brain fog can all overlap with thyroid problems. They can also come from poor sleep, iron deficiency, depression, overtraining, medication effects, or calorie restriction. Thyroid labs help narrow the field. They do not settle every case on their own.
For a healthspan framework, thyroid markers are less useful as a routine score to chase and more useful as a regulator check. They answer four practical questions:
- What they measure: Whether thyroid hormone production and feedback signaling look in range or disrupted.
- How they are tested: A standard blood draw.
- How quickly they can change: Usually over weeks, not days, especially after starting or adjusting medication.
- How to read them together: Pair TSH and Free T4 with symptoms, medication timing, repeat testing, and thyroid antibodies when autoimmune thyroid disease is a concern.
One caution matters here. Thyroid biomarkers are slower-moving than something like daily glucose, but they are still sensitive to context. Acute illness, biotin supplements, pregnancy, and inconsistent use of thyroid medication can distort interpretation. Testing under comparable conditions makes repeat results more useful.
A practical scenario makes the trade-offs clearer. Someone in midlife notices colder hands, less exercise tolerance, constipation, and a steady drop in energy. Thyroid testing can help decide whether this is a hormone regulation problem worth targeted follow-up, or whether sleep, anemia, mood, and training load deserve more attention first.
Used well, thyroid tests are not a generic wellness check. They are a focused tool for understanding metabolic pace, and they make more sense when read beside symptoms and the rest of the biomarker picture.
6. Apolipoprotein B and LDL Particle Number
A standard lipid panel can miss an important part of the picture. Two people can have the same LDL cholesterol result while carrying different numbers of cholesterol-containing particles in the blood. That difference matters because arteries are exposed to particles, not just to the amount of cholesterol packed inside them.
ApoB and LDL particle number try to count that traffic.
ApoB is the simpler marker to understand in practice. Each atherogenic lipoprotein particle, including LDL and VLDL remnants, carries one ApoB protein. In plain terms, ApoB works like a headcount of the particles most involved in plaque formation. LDL particle number aims at a similar question from a different testing method. Both markers are often most useful when the usual cholesterol numbers seem only mildly abnormal but the broader metabolic pattern suggests more risk.
The oncology comparison in the earlier draft does not help much here. Cardiovascular prevention has its own logic. The key point is straightforward. Test choice affects what you can see.
Here is a more practical way to place these markers in a healthspan framework:
- What they measure: The number of atherogenic particles that can enter artery walls.
- How they are tested: A blood test. ApoB is widely available. LDL particle number is usually part of a more specialized lipid test.
- How quickly they can change: Usually over weeks to months after sustained diet changes, weight loss, exercise, or lipid-lowering medication.
- How to interpret them together: Read them beside LDL cholesterol, triglycerides, HDL, blood pressure, smoking status, diabetes risk, hs-CRP, and family history of early cardiovascular disease.
The “together” part matters. A mildly high LDL cholesterol with normal triglycerides may tell a different story than the same LDL value paired with high triglycerides, low HDL, abdominal weight gain, and insulin resistance. In that second pattern, ApoB can clarify whether the bloodstream is carrying more atherogenic particles than LDL cholesterol alone suggests.
A common real-world example is a person whose annual labs show LDL that looks only somewhat high, while triglycerides are high and HDL is low. That pattern often reflects a larger number of cholesterol-carrying particles, even if each particle carries less cholesterol. ApoB can make that hidden burden easier to see.
There are trade-offs. ApoB is often easier to act on than LDL particle number because it is standardized, easier to access, and closely tied to the biology of atherosclerosis. LDL particle number can still be helpful, especially in discordant cases, but it is usually a second-step test rather than the first number to chase.
Used well, these markers are less about getting one perfect score and more about checking whether your lipid story is internally consistent. If the basic panel and the rest of the risk picture do not line up, ApoB or LDL particle number can help decide whether the concern is minor noise or a pattern worth addressing with a clinician.
7. Homocysteine
Homocysteine gets more attention than its role alone can support. It is useful, but usually as a clue about how the body is processing certain nutrients and amino acids, not as a stand-alone score for healthspan.
A practical way to place it in the bigger picture is this. Some biomarkers measure damage already in progress. Some measure capacity, like VO2 max. Homocysteine sits closer to a pathway marker. It can hint that the machinery handling methylation and methionine metabolism is under strain.
That matters because a high result can come from different causes. Low B12, low folate, low vitamin B6, reduced kidney function, certain medications, heavy alcohol use, and genetic variants can all shift it upward. The same lab value may point to very different next steps in different people.
Why context matters more than the number
Homocysteine works a bit like a check-engine light. It can signal that something deserves a closer look, but it does not identify the cause by itself.
For example, a person eating a highly restricted diet who also has fatigue or numbness may need a closer look at B12 status and absorption. An older adult with reduced kidney function may show a higher homocysteine value for a different reason. Someone else may have a mild elevation with otherwise ordinary labs, and the right response may be to review the pattern with a clinician instead of chasing one result.
So the useful question is not, “Is this score good or bad?” It is, “What process might this be reflecting?”
A compact framework helps:
- What it measures: A blood level of homocysteine, a metabolic intermediate involved in methylation and methionine handling.
- How it's tested: Standard blood draw, usually fasting depending on the lab or clinician preference.
- How quickly it can change: Often within weeks to a few months if the driver is nutritional and gets corrected.
- Best read alongside: B12, folate, vitamin B6 when relevant, kidney function, diet pattern, alcohol intake, symptoms, and overall cardiovascular context.
The trade-off is straightforward. Homocysteine can be more actionable than obscure specialty markers because the possible drivers are often familiar and testable. It is also easy to overread. Lowering homocysteine does not automatically mean risk has been reduced in a meaningful clinical sense.
Used well, this marker helps you connect dots. Used poorly, it becomes another isolated score that creates noise.
8. Fasting Glucose and Glucose Tolerance
A normal fasting glucose can create false reassurance.
Your body manages sugar in phases. Overnight fasting shows the baseline. A glucose tolerance test checks what happens after a challenge, more like watching a car handle a hill instead of only idling in the driveway. Someone can look fine at baseline and still struggle once glucose rises.
That is why this marker fits best in a healthspan framework, not as a pass fail score. It helps answer four practical questions at once. What part of glucose control are you measuring. How was it tested. How fast can it change. What other markers give it context.
Two tests, two different questions
Fasting glucose asks, “Where did blood sugar settle after no calories overnight?”
Glucose tolerance asks, “How efficiently did the body clear a measured glucose load over the next couple of hours?”
Those are related, but not interchangeable. Fasting glucose can stay in range for quite a while because the body is compensating. Post-meal or post-challenge control often starts to drift earlier. HbA1c adds a third angle by estimating average exposure over the past few months, but averages can hide spikes.
Here is the practical read:
- Fasting glucose measures: Baseline glucose regulation after an overnight fast.
- Glucose tolerance measures: How the body responds under metabolic stress after a glucose drink.
- How they're tested: A standard fasting blood draw, or a formal oral glucose tolerance test with timed blood samples.
- How quickly they can change: Often over weeks to months with changes in body weight, physical activity, sleep, acute illness, medications, or eating pattern.
- Best interpreted with: HbA1c, fasting insulin if available, waist size, activity level, sleep quality, and family history.
A useful way to picture the trade-off is this: fasting glucose is easier and cheaper, but it gives a narrower view. Glucose tolerance testing shows more about early dysfunction, but it is less convenient and not needed for everyone.
Symptoms can also shape the decision. A person whose fasting labs look ordinary but who feels sleepy after meals, unusually hungry soon after eating, or sluggish with central weight gain may need a closer look at glucose handling. Symptoms alone do not diagnose a problem. They can help explain why a clinician might look beyond one fasting number.
The main mistake is treating any one glucose marker as the whole story. A fasting value, an HbA1c, and a tolerance result each describe a different layer of the same system. Read together, they show whether glucose control is stable at baseline, strained under load, or drifting over time.
9. Sleep Duration and Quality Markers
A low lab score can look reassuring while poor sleep drags down recovery, appetite control, mood, and training tolerance. Sleep markers matter because they capture the condition your body spends a third of its time in, and they often change faster than blood tests.
This group of biomarkers measures patterns, not a single disease state. Common examples include total sleep time, time awake after falling asleep, sleep timing consistency, resting heart rate during sleep, heart rate variability, and wearable-estimated sleep stages. Together, they work like a nightly recovery log. One number rarely means much on its own. Repeated patterns matter more.
Consumer devices can help here, but with limits. An Oura ring, Apple Watch, Whoop band, or under-mattress sensor can estimate sleep reasonably well for trend tracking. They cannot confirm conditions such as sleep apnea or fully sort out unusual movements, nighttime breathing pauses, or complex insomnia. Formal sleep testing is still the right tool when symptoms suggest a disorder.
A practical way to use sleep markers is to separate four questions:
How much sleep are you getting?
Duration gives the broadest view, but it is the bluntest tool. Seven hours of broken sleep and seven hours of steady sleep do not have the same meaning.
How broken is the night?
Fragmentation, frequent awakenings, and long awake periods after sleep onset point to poor continuity. People often notice this as “I was in bed long enough, but I still feel unrefreshed.”
How hard is your body working overnight?
A higher-than-usual sleeping heart rate or a drop in heart rate variability can show strain from alcohol, illness, stress, heavy late exercise, or accumulated fatigue. These signals are sensitive, but not specific.
Is the schedule stable?
Irregular bedtimes and wake times can disrupt energy and appetite even when total hours look acceptable.
That is why sleep markers are often more useful as a cluster than as a score. If duration is adequate but fragmentation is high, the next question is different than if duration is short and timing is chaotic. If resting heart rate rises for several nights while sleep quality drops, recent stress, infection, travel, alcohol, or overreaching in training may explain the pattern better than “bad sleep” alone.
A simple example helps. Someone sees eight hours recorded on a wearable and assumes recovery is fine. Then they look closer and find repeated awakenings, late bedtimes, and a higher sleeping heart rate after evening alcohol. The useful insight is not the headline number. It is the combination.
Use these markers to spot repeatable triggers:
- travel or jet lag
- alcohol
- heavy evening meals
- inconsistent sleep timing
- high caffeine intake late in the day
- stress
- hard training without enough recovery
Night-to-night swings are common, so caution matters. One rough night usually does not require action. A pattern over a few weeks is more informative, especially if it lines up with daytime sleepiness, snoring, morning headaches, trouble concentrating, or declining exercise performance.
If persistent fatigue is the main complaint, do not reduce the issue to willpower or motivation. Sleep data can point toward short sleep, poor continuity, or a breathing-related problem worth discussing with a clinician. Longwelle's article on why you might feel tired even when you think you should be fine is a useful starting point for that conversation.
10. Longwelle Integration and Cross-cutting Recommendations
More biomarker data does not automatically mean better decisions. A shorter set of markers, repeated consistently and read in context, usually gives a clearer picture of healthspan.
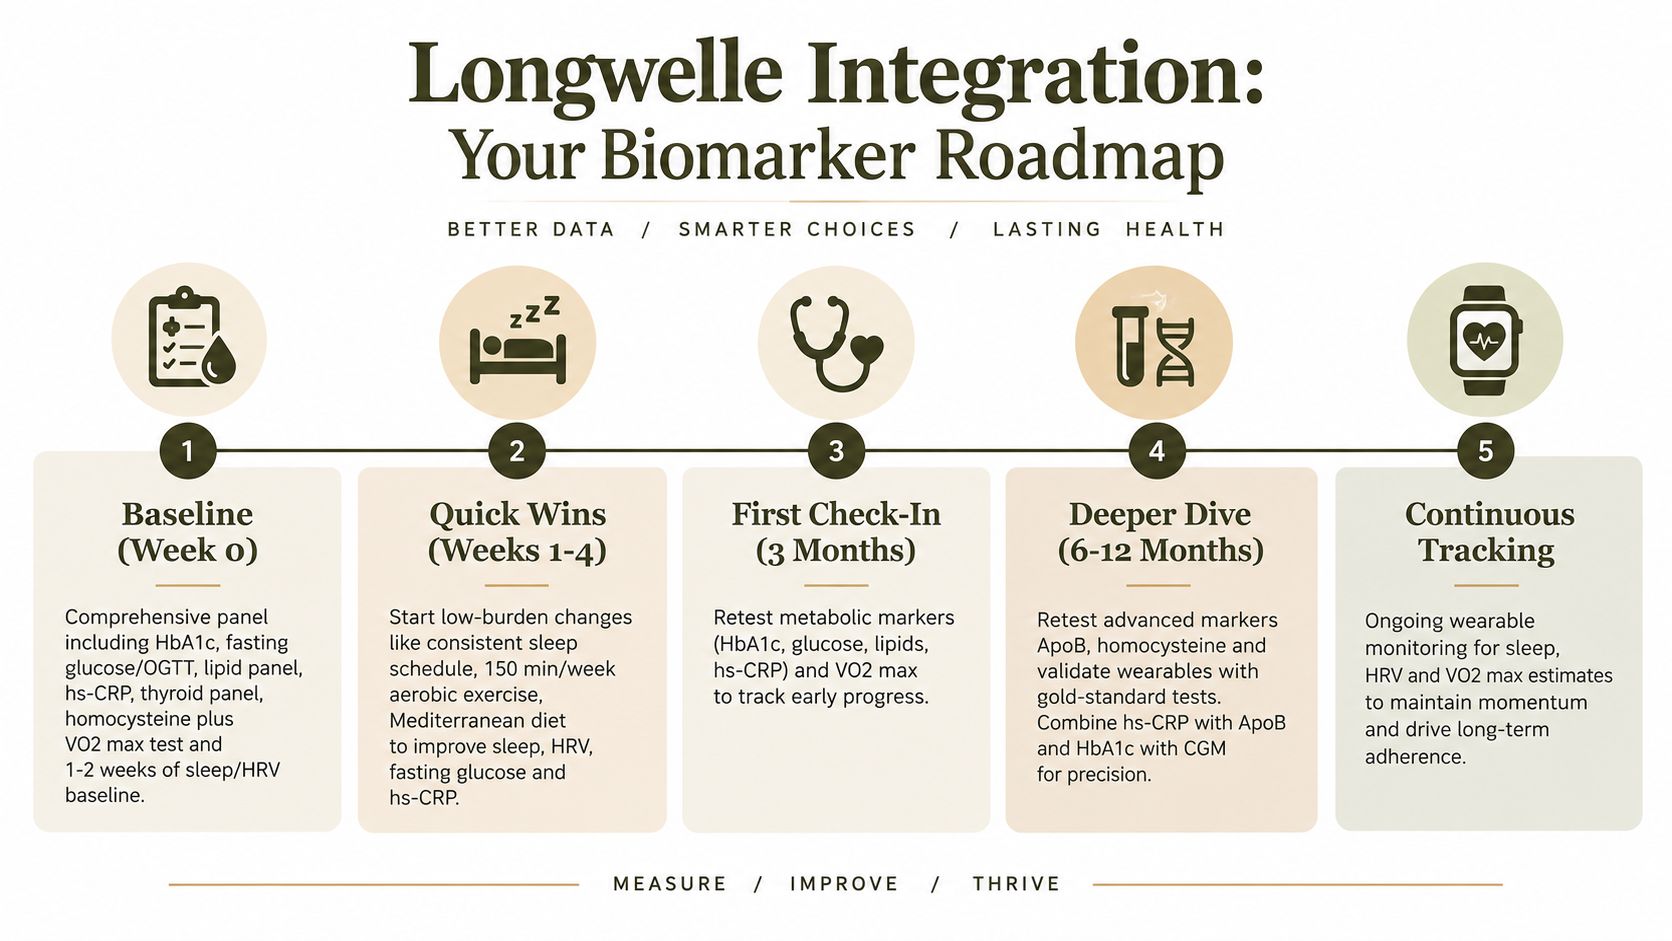
A practical way to make sense of the ten examples in this article is to sort them by function, not by lab report order. Some markers measure fuel handling, such as HbA1c, fasting glucose, glucose tolerance, and triglycerides. Some estimate cardiovascular particle burden and inflammation, such as a lipid panel, ApoB, and hs-CRP. Others reflect regulation and recovery, such as thyroid labs, sleep markers, and VO2 max.
That framework matters because each type of marker behaves on a different clock. Sleep can change overnight. Resting glucose may shift over days to weeks. HbA1c usually needs a few months to show a meaningful change. ApoB and triglycerides can respond within weeks, while VO2 max often needs a training block, not a few good workouts. If you expect every marker to move at the same speed, normal biology can look confusing.
A simple rule helps. Match the recheck interval to the biology of the marker and to the question you are asking.
Here is a practical way to read the set together:
- Fast-moving markers: sleep patterns, resting heart rate trends, exercise tolerance, fasting glucose. These are useful for spotting short-term effects from illness, training load, travel, stress, meal timing, or alcohol.
- Medium-speed markers: triglycerides, hs-CRP, some thyroid values, and sometimes ApoB after diet or medication changes. These can help you judge whether a recent intervention is starting to work.
- Slow-moving markers: HbA1c and durable fitness changes such as VO2 max trends over months. These are better for confirming direction than for judging last week's habits.
Clusters are usually more informative than single numbers. HbA1c at the high end of normal means something different if fasting glucose is also drifting up and triglycerides are high, versus if fasting glucose is stable and activity has recently improved. A mildly high hs-CRP may point in a different direction if ApoB is low and there was a recent infection than if ApoB, blood pressure, and waist circumference are all rising. Thyroid results also need context. TSH without free T4, symptoms, medication timing, and repeat testing can mislead.
One useful mental model is a dashboard. A warning light matters more when other gauges are shifting in the same direction. One isolated result can be noise. A pattern across systems deserves attention.
Longwelle's AI health coach for applying biomarker and habit insights between check-ins fits that use because it keeps day-to-day follow-through tied to the markers that are changing, instead of treating every result as equally urgent.
If you want a workable plan, start with three questions:
- What does this marker measure? Blood sugar exposure, inflammation, particle number, thyroid signaling, fitness, or sleep and recovery.
- How is it tested? Blood draw, wearable trend, home measurement, or exercise test.
- How fast should it change? Overnight, over weeks, or over months.
Those questions reduce overreaction. They also make it easier to choose the next step, whether that means improving sleep regularity, adjusting training, reviewing medications, changing diet quality, or discussing repeat testing with a clinician.
Comparative Overview of 10 Biomarkers
| Biomarker / Item | Implementation complexity 🔄 | Resource requirements ⚡ | Expected outcomes ⭐ | Ideal use cases 📊 | Key tips 💡 |
|---|---|---|---|---|---|
| VO2 Max (Cardiorespiratory Fitness) | Moderate, lab GXT high, wearables low | Moderate–High, lab equipment or consumer wearables | ⭐⭐⭐⭐, strong predictor of CV fitness & longevity | Track aerobic fitness, training response, CV risk stratification | Retest 3–6 months; validate wearables annually; use age-adjusted targets |
| HbA1c (Glycated Hemoglobin) | Low, single non-fasting blood test | Low, inexpensive, widely available | ⭐⭐⭐⭐, gold-standard for chronic glucose control | Diabetes/prediabetes screening and long-term metabolic monitoring | Test every 3–6 months; target <5.7% for optimal longevity; combine with CGM for variability |
| hs-CRP (Inflammation) | Low, routine blood test | Low, inexpensive, often included in panels | ⭐⭐⭐, useful CVD/inflammation predictor, best with other markers | Detect inflammaging; monitor response to diet, sleep, stress reduction | Establish baseline; repeat 3–6 months; avoid testing during acute illness |
| Lipid Panel (Total/LDL/HDL/TG) | Low, fasting recommended (12h) | Low, standard lab test | ⭐⭐⭐⭐, foundational CVD risk marker with long evidence base | Baseline CV risk assessment and therapy monitoring | Fast 12h; retest 3–6 months during interventions; consider advanced markers if borderline |
| Thyroid Function (TSH, Free T4/T3) | Low, simple blood tests; interpretation moderate | Low, widely available | ⭐⭐⭐⭐, high clinical relevance for energy/metabolism | Evaluate fatigue, weight, cognitive changes in midlife | Request full panel + antibodies if symptomatic; retest 6–8 weeks after dose changes |
| ApoB & LDL Particle Number | Moderate, specialized assays (NMR/Ion Mobility) | Moderate, higher cost, not universal | ⭐⭐⭐⭐, superior specificity for atherogenic particle risk | Advanced CV risk when LDL-C is discordant or family history of early CVD | Order if borderline LDL or strong FHx; track 6–12 months; combine with hs-CRP |
| Homocysteine | Low, fasting blood test | Low, inexpensive | ⭐⭐⭐, moderate independent risk; responsive to B‑vitamins | Cognitive decline/CVD risk evaluation; suspected B‑vitamin deficiency | Treat with B12/folate/B6 if high; retest 6–8 weeks; consider methylation status |
| Fasting Glucose & OGTT | Low (fasting) to Moderate (OGTT time) | Low to Moderate, OGTT requires clinic time | ⭐⭐⭐⭐, OGTT sensitive for early glucose intolerance; fasting simple snapshot | Detect prediabetes/hidden intolerance; OGTT for high-risk individuals | Use OGTT when risk high; pair with fasting insulin or CGM; retest after lifestyle changes |
| Sleep Duration & Quality (Actigraphy, HRV, PSG) | Low (wearables) to High (PSG) | Low-continuous (wearables) to High (lab PSG) | ⭐⭐⭐⭐, large downstream impact on metabolism, cognition, recovery | Energy optimization, recovery monitoring, inflammaging mitigation | Baseline 1–2 weeks with wearables; prioritize consistent schedule; avoid orthosomnia |
| Longwelle Integration & Cross-cutting Recommendations | Moderate, multi-test coordination and interpretation | Moderate, combined labs + wearables | ⭐⭐⭐⭐, combined markers enable precise, actionable plans | Comprehensive personalized risk assessment and behavior change planning | Start with low-burden changes; use short-term markers for feedback; tailor advanced tests to risk |
Build a Biomarker Plan You Can Actually Use
The biggest mistake people make with examples of biomarkers is treating each one like a separate grade. That usually creates confusion. A better approach is to group biomarkers by the kind of question they help answer.
Start with metabolic markers if glucose regulation is a priority. HbA1c, fasting glucose, and glucose tolerance testing help clarify whether energy dips, weight changes, or family history point toward early metabolic strain. These markers are often more useful together than apart because they capture both longer-term exposure and real-time handling.
Cardiovascular markers come next for many adults over 40. A standard lipid panel is still a practical entry point, but it becomes more informative when you look at particle-related risk through ApoB and compare that with blood pressure, activity, and family history. hs-CRP adds inflammatory context, which can help frame whether risk seems isolated or part of a broader pattern.
Thyroid testing belongs in a symptom-driven lane. If energy has dropped, temperature tolerance has changed, or unexplained weight shifts are showing up, thyroid markers can help narrow the field. They aren't generic performance markers, and they shouldn't be used that way.
Wearable measures fill a different role. VO2 max trends, sleep timing, resting heart rate, and recovery markers are especially useful because they connect quickly to daily behavior. They also make biomarker tracking feel less abstract. You can often see how travel, training, stress, alcohol, or bedtime consistency changes the pattern.
Some newer areas of longevity testing, including cellular senescence signals and epigenetic clocks, are promising but still less settled for routine personal decision-making. Consumer-facing biomarker education often skips this distinction. It also often skips a basic but important point. A biomarker doesn't have to be a blood test. Broad overviews explicitly include blood pressure, body weight, genes, proteins, urine markers, imaging, and physiologic traits within the biomarker umbrella, as explained in this overview of biomarker types and applications.
Keep your interpretation cautious. Reference ranges matter, but so do symptoms, medications, recent illness, training status, menstrual status where relevant, and personal risk factors. An “abnormal” result may need follow-up, repeat testing, or a broader workup. A “normal” result doesn't always mean nothing is wrong. Biomarkers are tools for better questions, not shortcuts around clinical judgment.
The most practical sequence is usually this:
- Establish a baseline: Choose testing that fits your age, symptoms, and goals.
- Pick a few high-value markers: Don't start with everything at once.
- Make one or two sustainable changes: Sleep, movement, nutrition, stress, or recovery habits.
- Track over a meaningful interval: Long enough for the marker to respond.
- Review the trend with context: Especially if symptoms and lab values don't match.
If you want a structured version of that process, Longwelle is one relevant option. Its assessment, educational tools, biomarker monitoring, and optional nurse practitioner support are designed to help adults use results for supervised lifestyle decisions rather than score-chasing.
Longwelle offers a brief assessment, science-informed education, biomarker tracking, and optional licensed nurse practitioner consultations for adults who want a more organized healthy-aging plan. If you want help turning lab results, sleep data, and recovery trends into practical next steps, visit Longwelle.