Learn
Longevity Blood Test Guide: Markers, Meaning, and Frequency
Learn which longevity blood test markers actually matter, what they reveal about aging risk, and how often to test for lasting healthspan insights.
You feel healthy. You exercise, sleep reasonably well, and get through demanding workdays without obvious symptoms. Yet at some point in midlife, “I feel fine” stops answering the question you have: what is changing beneath the surface, and do I have a useful baseline?
A longevity blood test can help start that conversation. It doesn't predict your lifespan or produce a definitive biological-age score. Instead, it offers a repeatable view of systems that influence future health, including lipid transport, glucose regulation, inflammation, liver function, kidney filtration, iron handling, and selected hormone or nutrient status.
The useful mindset is simple: your first panel is not a report card. It's the first point on a dashboard. One result can be noisy. A pattern that moves in the wrong direction across repeated tests deserves attention, especially when it aligns with changes in energy, strength, sleep, waist measurement, blood pressure, or exercise capacity.
Table of Contents
- Why a Longevity Blood Test Belongs in Your Routine
- What a Longevity Panel Is Really Measuring
- Cardiometabolic and Glycemic Markers That Drive Aging Risk
- Inflammation, Liver, Kidney, and Iron Markers You Should Not Skip
- Hormones and Nutrient Markers Worth the Draw
- Core Panel Versus Optional Add-Ons
- How Often to Test and How to Read the Trend
- Turning Your Numbers Into a Longevity Plan
Why a Longevity Blood Test Belongs in Your Routine
A routine physical often answers an important question: do you have an obvious problem that needs attention today? A longevity-oriented panel asks a different question: which quiet risk patterns might be worth addressing before they become symptomatic?
A 45-year-old professional might have normal energy, a regular running habit, and no diagnosed condition, while still lacking objective information about glucose control, atherogenic particle burden, low-grade inflammation, or kidney reserve. Bloodwork can provide a practical baseline for those systems. It doesn't replace a clinical history or examination, but it gives you something concrete to discuss with a qualified clinician.
Start with a baseline, not a diagnosis
Think of baseline testing as a conversation with your future self. You're recording how your body is functioning now so later results can be interpreted against your own history, not only against a broad laboratory reference interval.
That distinction matters because “within range” doesn't always mean “ideal for your goals.” A result can sit inside a population reference range while another marker suggests emerging metabolic strain. The interpretation becomes more useful when several values are viewed together rather than when one number is treated as a verdict.
A large study of centenarians found that exceptional longevity was associated with higher total cholesterol and iron, alongside lower glucose, creatinine, uric acid, AST, GGT, ALP, LD, and TIBC. The practical lesson isn't that everyone should push cholesterol or iron higher. It's that longevity interpretation needs a multi-system view covering glycemic load, kidney function, liver stress, and iron handling, as described in the centenarian biomarker study.
Practical rule: Use a longevity blood test to identify patterns worth investigating, not to label yourself as biologically young or old.
Bloodwork becomes especially valuable when you repeat it under reasonably similar conditions and pair it with the behaviors that may influence the result. A clinician can then distinguish a temporary fluctuation from a persistent trend and decide whether further testing, lifestyle work, or treatment is appropriate.
What a Longevity Panel Is Really Measuring
No blood test measures “aging” directly. A panel uses measurable biological signals as proxies for the systems that tend to influence health as people grow older. Those systems include cardiovascular risk, glucose regulation, immune activity, liver processing, kidney filtration, endocrine function, and nutritional status.
The strongest interpretation comes from composite signals. ApoB may describe the number of atherogenic particles, while triglycerides and fasting insulin add context about metabolic handling. Cystatin C and eGFR contribute information about kidney filtration, while liver enzymes and ferritin can point toward other aspects of physiologic reserve.
Reference ranges are not the whole interpretation
A standard physical usually focuses on detecting established disease or clearly abnormal findings. A longevity panel can be more useful when it's designed for trendability, meaning the same markers are repeated and interpreted over time.
Expert guidance on aging biomarkers proposes that a meaningful aging biomarker should predict aging rate and mortality better than chronological age, remain repeatable over time, and reflect underlying biology rather than one isolated disease process. The same framework emphasizes that no currently available blood biomarker can precisely forecast an individual's lifespan, so the responsible use of these tests is risk stratification and monitoring, not deterministic prediction. See the framework for blood-based biomarkers in geroscience.
That changes how you read the report. A single hs-CRP result may reflect a recent infection or hard training session. A persistently unfavorable combination of ApoB, HbA1c, fasting insulin, and triglycerides presents a different clinical question. The panel has value when it helps you and your clinician decide what to investigate, what to change, and what to measure again.
Cardiometabolic and Glycemic Markers That Drive Aging Risk
Cardiometabolic markers form the practical center of most longevity blood testing. They help describe how your body transports lipids, manages glucose, and responds to insulin demand.
ApoB is particularly useful because it reflects the number of cholesterol-carrying atherogenic particles, not the amount of cholesterol inside them. LDL-C remains important context, but two people with similar LDL-C values can have different particle burdens. HDL-C and triglycerides add further information, especially when triglycerides rise alongside signs of impaired glucose handling.
HbA1c estimates average blood glucose over the preceding period represented by the test. It can reveal sustained glycemic exposure that a single fasting glucose measurement might miss. Fasting insulin adds another layer. Glucose can remain apparently acceptable while the pancreas produces more insulin to maintain it, making insulin a potentially earlier signal of metabolic dysfunction.
Read the markers as a group
| Marker | Standard reference | Optimal for longevity | Aging risk it signals |
|---|---|---|---|
| ApoB | Use the laboratory interval and individual cardiovascular risk | Lower exposure is generally preferable, with targets individualized by risk | Atherogenic particle burden |
| LDL-C | Laboratory reference interval | Lower when clinically appropriate | Cholesterol carried in LDL particles |
| HDL-C | Laboratory reference interval | Interpret with the full lipid pattern | Lipid transport context, not a standalone protection score |
| Triglycerides | Laboratory reference interval | Lower values with stable glucose control | Metabolic stress and insulin resistance pattern |
| HbA1c | Laboratory reference interval | Stable glucose regulation without upward drift | Sustained glycemic exposure |
| Fasting insulin | Laboratory reference interval | Lower insulin demand with normal glucose, interpreted clinically | Early metabolic dysfunction |
These markers can also expose the “normal but not optimal” middle zone. A result that doesn't trigger a diagnosis may still be moving unfavorably compared with your previous baseline. That's where trend, family history, blood pressure, body composition, sleep, and physical activity become relevant.
Clinical reading habit: Don't ask only, “Is this in range?” Ask, “What story do these markers tell together, and is that story changing?”
Insulin resistance matters beyond diabetes risk because impaired glucose handling can affect vascular health, energy regulation, and brain health. If persistent fatigue or concentration problems accompany an unfavorable pattern, keep the investigation broad rather than assuming the cause. A useful companion resource is this guide to brain fog and possible contributing factors.
When a value sits in the middle zone, avoid reacting with an aggressive supplement stack. Confirm the testing conditions, review recent illness and training, examine diet and sleep, and discuss a focused intervention with a clinician. Then recheck the markers that could plausibly respond to that intervention.
Inflammation, Liver, Kidney, and Iron Markers You Should Not Skip
A cardiometabolic panel tells only part of the story. Inflammation, organ function, and iron handling can change the interpretation of otherwise ordinary-looking results.
High-sensitivity C-reactive protein, or hs-CRP, is a marker of inflammatory activity. It can be useful when interpreted alongside lipids and metabolic markers, but it's nonspecific. A recent infection, injury, intense exercise, or another inflammatory condition may temporarily raise it. Repeated elevation deserves context rather than an automatic label of “inflammaging.”
The liver group usually includes ALT, AST, and GGT. These enzymes don't measure liver reserve in isolation, and normal values can't rule out every liver problem. Still, a rising pattern, particularly when it appears with triglyceride or insulin changes, may justify a closer review of alcohol intake, medications, body composition, metabolic health, and other clinical factors.
Kidney function needs context
Creatinine is influenced by muscle mass, diet, hydration, and other variables. Cystatin C offers a complementary view, while eGFR translates filtration estimates into a clinically interpretable measure. Looking at creatinine alone can therefore be misleading in a muscular person, an older adult with low muscle mass, or anyone whose hydration and recent exercise differed between tests.
Iron markers require the same caution. Ferritin can reflect stored iron, but it may also rise with inflammation. Transferrin saturation helps assess how much circulating iron is being carried relative to binding capacity. Both insufficient iron and excessive iron can create different health concerns, so “higher is better” is not a safe longevity rule.
| Marker | What it tracks | Aging risk signal | Typical optimal range |
|---|---|---|---|
| hs-CRP | Systemic inflammatory activity | Persistent low-grade inflammation requiring clinical context | Use repeat values and laboratory guidance |
| ALT, AST | Hepatic and tissue enzyme release | Possible liver or metabolic stress when persistently elevated | Interpret against the lab interval and pattern |
| GGT | Hepatic enzyme activity with metabolic and oxidative-stress context | Rising values may accompany liver or metabolic dysfunction | Use the lab interval and repeat trend |
| Creatinine with eGFR | Estimated kidney filtration | Declining filtration or misleading creatinine interpretation | Interpret eGFR with age, muscle mass, and clinical history |
| Cystatin C | Complementary filtration signal | Kidney risk that creatinine may obscure | Use laboratory and clinician interpretation |
| Ferritin | Iron stores and inflammatory context | Deficiency, overload, or inflammation depending on the pattern | Pair with transferrin saturation |
| Transferrin saturation | Circulating iron availability | Possible iron deficiency or excess | Interpret with ferritin and blood count |
The centenarian research cited earlier linked lower creatinine, AST, GGT, and several other markers with reaching age 100, but those associations don't establish individual treatment targets. They support a broader principle: physiologic reserve is multi-system, and no single “optimal” value can carry the whole interpretation.
Hormones and Nutrient Markers Worth the Draw
Hormone testing creates noise when people use it to chase a youthful number without symptoms, medication review, or repeat confirmation. It becomes more useful when a clinician has a specific question.
For testosterone, consider total testosterone, free testosterone, and SHBG together. A total value can look adequate while binding differences change the free fraction. Estradiol may add context in selected cases, but hormone results must be interpreted by sex, age, symptoms, medications, timing, and the clinical reason for testing. The objective isn't to recreate a younger person's peak. It's to identify a meaningful deficiency, excess, or treatment effect.
Use thyroid tests to investigate a pattern
TSH is often the initial thyroid marker, with free T4 and, where clinically appropriate, free T3 adding context. Thyroid function can influence energy, temperature tolerance, heart rate, bowel habits, mood, and body weight. Testing without symptoms or a clear clinical question can produce borderline findings that lead to unnecessary worry and repeat investigations.
Vitamin D is typically assessed through 25-hydroxyvitamin D. It can help evaluate bone and musculoskeletal reserve, particularly when risk factors or symptoms make the test relevant. More isn't automatically better, and supplementation should follow a measured need rather than a generic longevity promise.
B12 and folate matter because inadequate status can affect blood formation and neurological function, while also influencing homocysteine metabolism. Ferritin and transferrin saturation belong with this assessment when iron status is uncertain, but ferritin shouldn't be interpreted without considering inflammation and the rest of the blood picture.
| Marker | System reflected | Clinical value | When to retest |
|---|---|---|---|
| Total and free testosterone | Reproductive and metabolic systems | Useful for symptoms, confirmed deficiency, or treatment monitoring | Repeat when clinically indicated and under comparable conditions |
| SHBG and estradiol | Hormone transport and sex-hormone balance | Clarifies selected testosterone or reproductive questions | Repeat with the relevant hormone assessment |
| TSH, free T4, free T3 | Thyroid regulation | Investigates symptoms or known thyroid disease | Follow clinician guidance and treatment changes |
| 25-hydroxyvitamin D | Bone, muscle, and immune-related status | Identifies deficiency risk when testing is appropriate | Recheck after a meaningful intervention or clinical change |
| B12 and folate | Blood and neurological function | Investigates deficiency, macrocytosis, neuropathy, or homocysteine concerns | Recheck after treatment when status needs confirmation |
| Ferritin and transferrin saturation | Iron storage and transport | Distinguishes possible deficiency, overload, or inflammatory elevation | Repeat after investigation or treatment |
If tiredness is the main reason you're considering these tests, start with symptoms, sleep quality, medication effects, blood count, thyroid context, glucose regulation, and iron status rather than ordering every hormone available. This guide to persistent tiredness can help organize the questions you bring to a clinician.
Core Panel Versus Optional Add-Ons
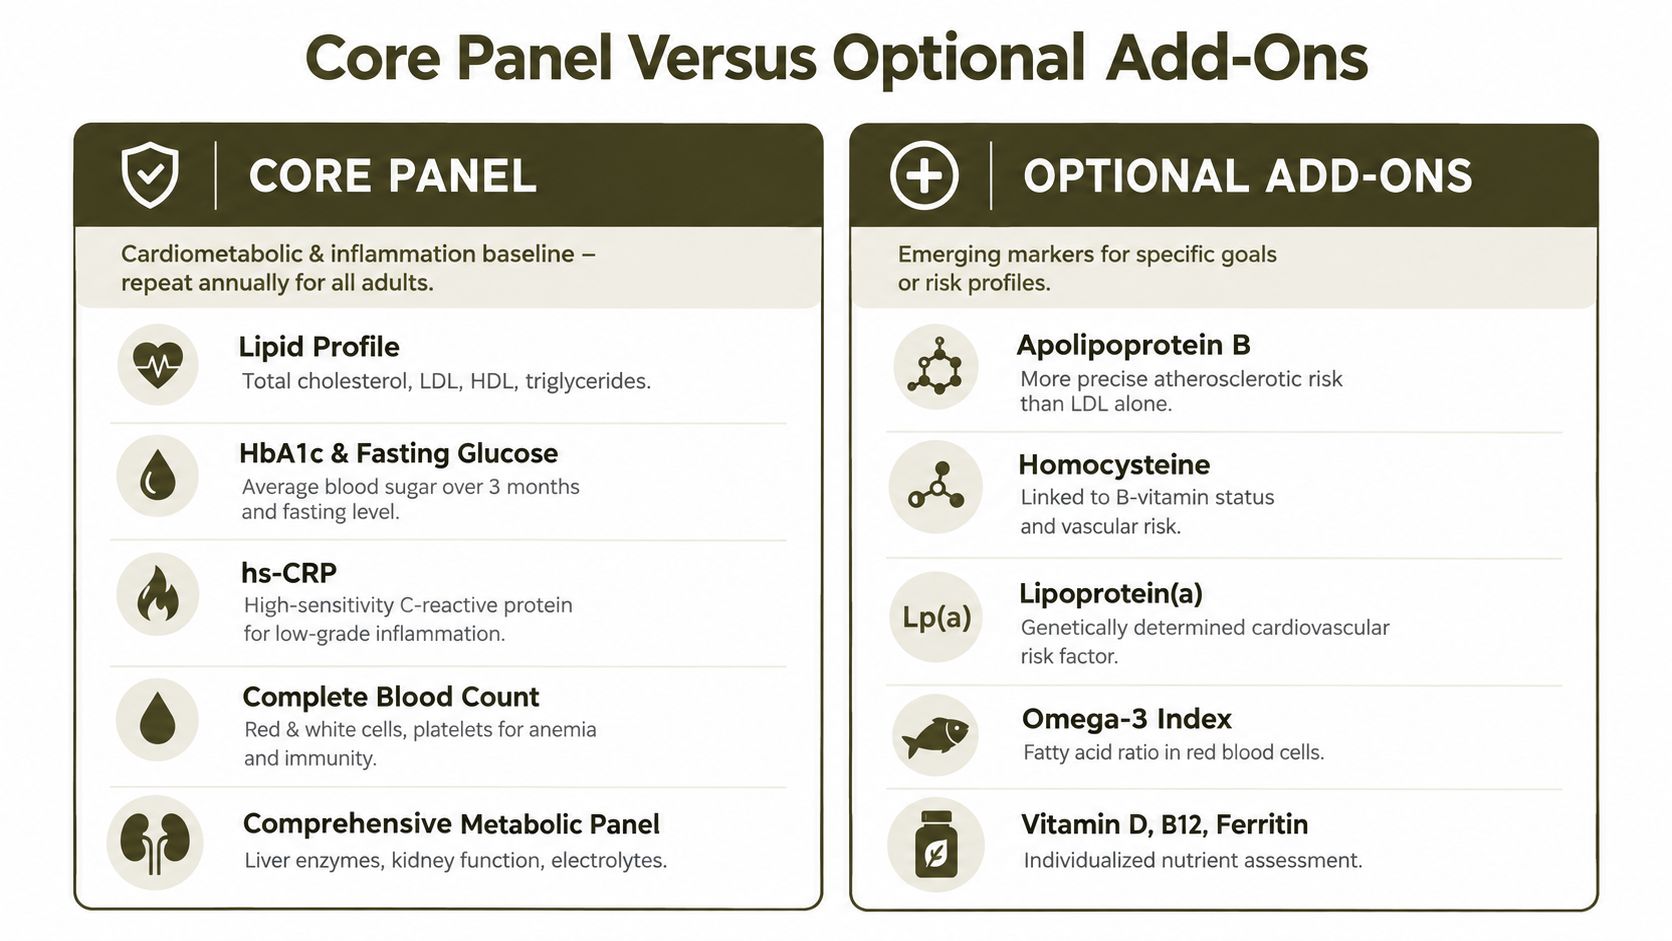
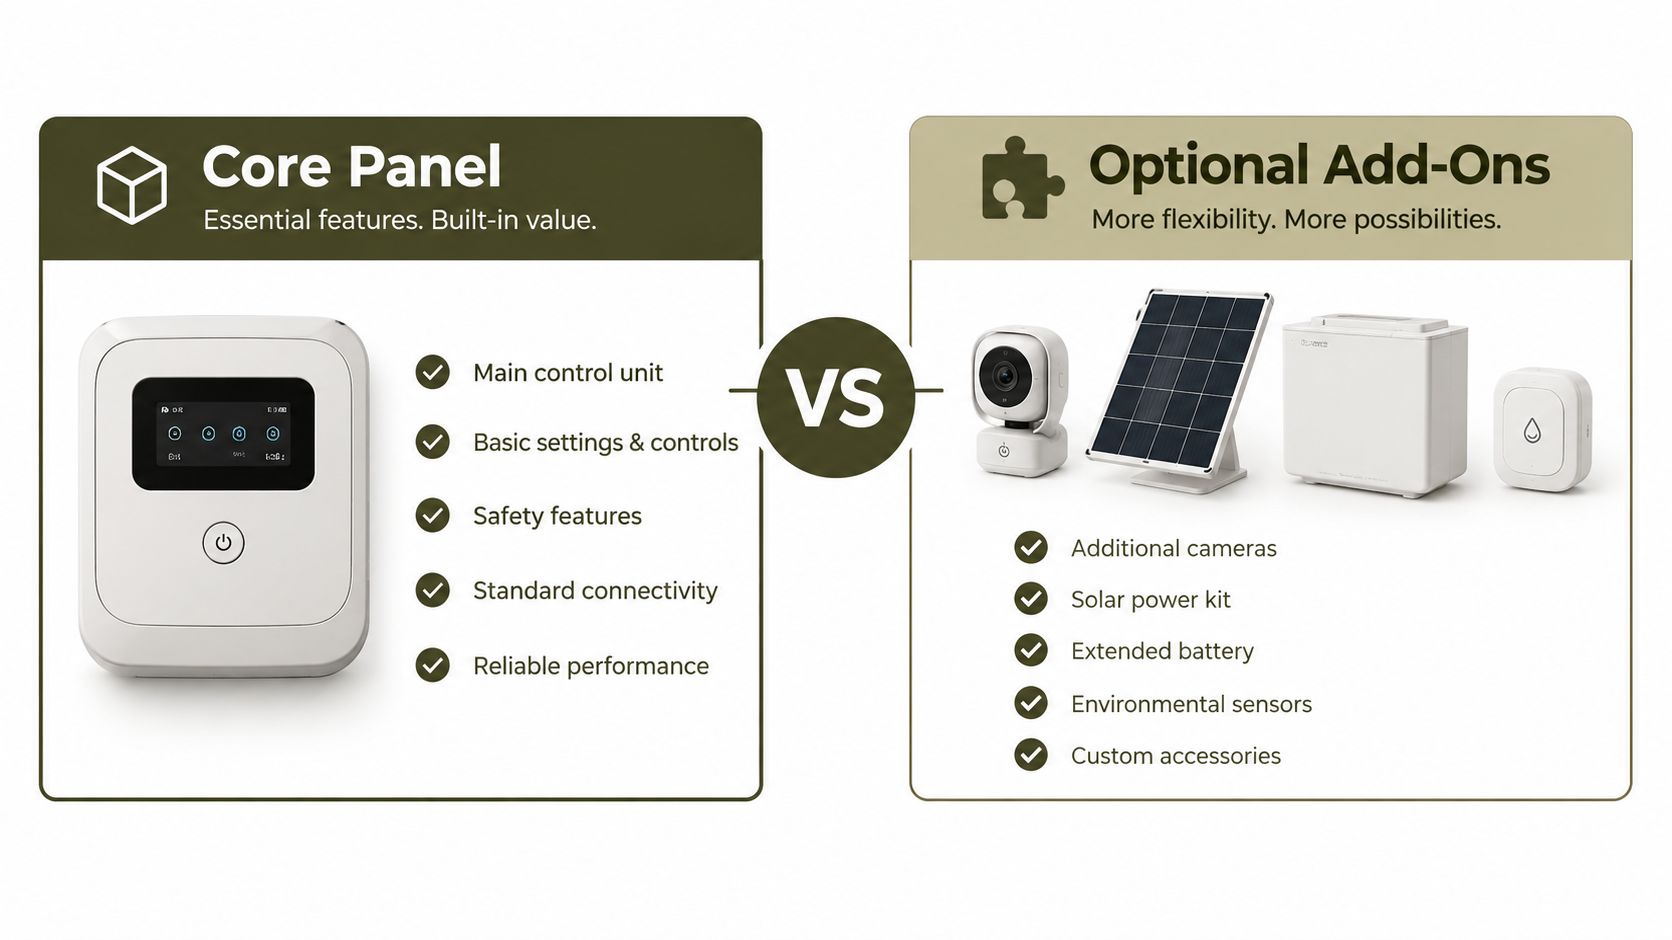
A high-value core panel should answer questions that are common, actionable, and suitable for repeated measurement. That usually means a lipid profile with ApoB where appropriate, HbA1c, fasting glucose, and possibly fasting insulin, alongside hs-CRP, a complete blood count, metabolic markers, kidney filtration markers, liver enzymes, and selected iron or nutrient tests based on personal context.
Optional testing earns its place when it changes the next decision. Lipoprotein(a) can be relevant when inherited cardiovascular risk is a concern. Homocysteine may help investigate B-vitamin status or a specific vascular or neurological question. Advanced lipid subfractionation, an omega-3 index, IGF-1, broader sex-hormone panels, and consumer biological-age products may be reasonable for selected goals, but they shouldn't distract from the core markers.
Apply one decision rule
Ask three questions before paying for an add-on:
- What question does this test answer? Define the clinical or personal-risk question in plain language.
- What action would follow? Identify the behavior, medication discussion, imaging referral, or monitoring change.
- Would a different result alter that action? If not, the test may add information without adding value.
Newer models are also moving beyond a single biological-age score. A 2026 Nature Medicine study reported plasma proteomic signatures estimating aging across 11 organ systems and predicting disease risk years in advance, as summarized in independent coverage of longevity blood testing. This is a more nuanced use case than treating one age-like number as a complete health assessment, but it remains an emerging tool rather than a replacement for routine clinical risk evaluation.
The core panel deserves consistent attention because it produces a longitudinal dashboard. Add-ons should answer a defined question, not satisfy curiosity alone.
How Often to Test and How to Read the Trend
Testing frequency should follow the marker, the reason for testing, and what you're changing. A person establishing a baseline may need a broad assessment, while someone actively addressing ApoB or glycemic control may need a narrower follow-up panel. Your clinician should also adjust the schedule for diagnosed conditions, medication use, pregnancy, acute illness, or abnormal findings.
Match the interval to the biology
Markers that respond to diet, training, body composition, sleep, or treatment can be reviewed sooner after a meaningful change. HbA1c represents average glucose over a preceding multi-week period, so checking it immediately after a change won't show the full effect. Fasting insulin and triglycerides may shift sooner, but one short-term result still needs consistent preparation and interpretation.
Thyroid markers, ferritin, sex hormones, and vitamin status often require a longer interval or a specific treatment-related schedule. The important point is not to create a rigid calendar for everyone. It's to avoid testing so frequently that ordinary variation looks like a major biological event.
| Marker group | Recheck interval | Why this cadence |
|---|---|---|
| ApoB, lipid profile, fasting insulin, triglycerides | After a focused intervention, according to clinician guidance | These markers can help assess response to a defined metabolic or lipid strategy |
| HbA1c and fasting glucose | After enough time has passed to represent the changed pattern | HbA1c reflects average glycemic exposure rather than one day |
| hs-CRP | Repeat when clinically appropriate and outside acute illness | Temporary inflammation can distort a single result |
| Liver and kidney markers | Periodic maintenance review, or sooner if abnormal | Supports monitoring of organ-related trends and treatment effects |
| Ferritin and transferrin saturation | Follow-up after investigation or treatment | Iron status needs paired interpretation and time for meaningful change |
| Thyroid and sex hormones | Symptom- or treatment-led schedule | Timing, medication, and biological variation affect interpretation |
| Vitamin D, B12, and folate | After a documented deficiency or intervention when confirmation is needed | Shows whether status changed without encouraging unnecessary frequent testing |
Track slope, not perfection
Use the same laboratory where practical, record fasting status, note recent illness and hard training, and keep medication and supplement details with the report. A trend spreadsheet can be simple. Record the date, marker, unit, reference interval, preparation, and any major change in sleep, diet, exercise, or treatment.
The most useful question is often, “Which two or three markers are moving in the wrong direction?” Not every value needs to reach an idealized target at once.
A broad baseline can be followed by focused monitoring of actionable markers, with maintenance reviews for the wider panel. If several systems drift together, bring the complete trend report to a clinician rather than ordering more isolated tests.
Turning Your Numbers Into a Longevity Plan
A result becomes useful only when it changes a reasonable next step. If fasting insulin is persistently unfavorable, review resistance training, meal composition, sleep, and body-composition goals. If ApoB is high, discuss dietary fat quality, soluble fiber, exercise, family history, and whether medical treatment is appropriate. If hs-CRP rises repeatedly, look for infection, injury, inflammatory disease, excess training load, sleep disruption, and other causes before reaching for an anti-inflammatory supplement.
Nutrient findings also need targeted action. Vitamin D status may prompt a clinician-guided plan involving diet, safe sun exposure, or supplementation. Low B12, abnormal ferritin, or an altered blood count deserves investigation rather than an assumption that a multivitamin solves the cause. Hormone treatment should be based on symptoms, confirmed findings, contraindications, and dose-adjusted monitoring.
Bloodwork is one input among sleep, movement, strength, emotional health, nutrition, and social connection. Share your trend report with a clinician experienced in preventive care when several markers worsen, a result sits well outside its reference interval, symptoms persist, or you're considering hormones, peptides, or supplements. For a broader framework, use this longevity guide alongside medical advice.
Longwelle offers a brief longevity assessment, educational guidance, biomarker tracking, and access to licensed nurse practitioners for optional result discussions. Visit Longwelle to organize your next steps around a trended dashboard rather than a one-time longevity blood test.